
There is a specific kind of financial magic involved in running a semiconductor giant that is currently shrinking. In the case of QUALCOMM Incorporated (QCOM), the magic involves a delicate balance of massive share repurchases, executive compensation, and a valuation that sits uncomfortably close to the yield of a risk-free government bond. To the casual observer, Qualcomm is the indispensable architect of the 5G era. To the forensic auditor, it is a company running very fast on a capital allocation treadmill just to stay in the same place.
The core tension in the Qualcomm story is the spread. The company currently offers a Free Cash Flow (FCF) yield of 5.45%. In a vacuum, that sounds respectable. However, when measured against the 10-Year Treasury yield of 4.99%, the resulting Equity Risk Premium is a mere 0.46%. Investors are essentially accepting the entire operational risk of the global smartphone market, the cyclicality of the semiconductor industry, and the looming threat of internal chip development from major customers for a payout that is only 46 basis points higher than what Uncle Sam offers for sitting on a beach.
The Buyback Mirage and the Dilution Reality
Qualcomm has long been a darling of the “total shareholder return” crowd. The company consistently deploys billions of dollars to repurchase its own shares, a move usually celebrated as a sign of confidence. However, a close look at the recent Form 8-K filed on September 8, 2026, reveals a more complicated picture. The filing disclosed unregistered sales of equity securities, a technical way of saying the company is still issuing shares even as it tries to retire them.
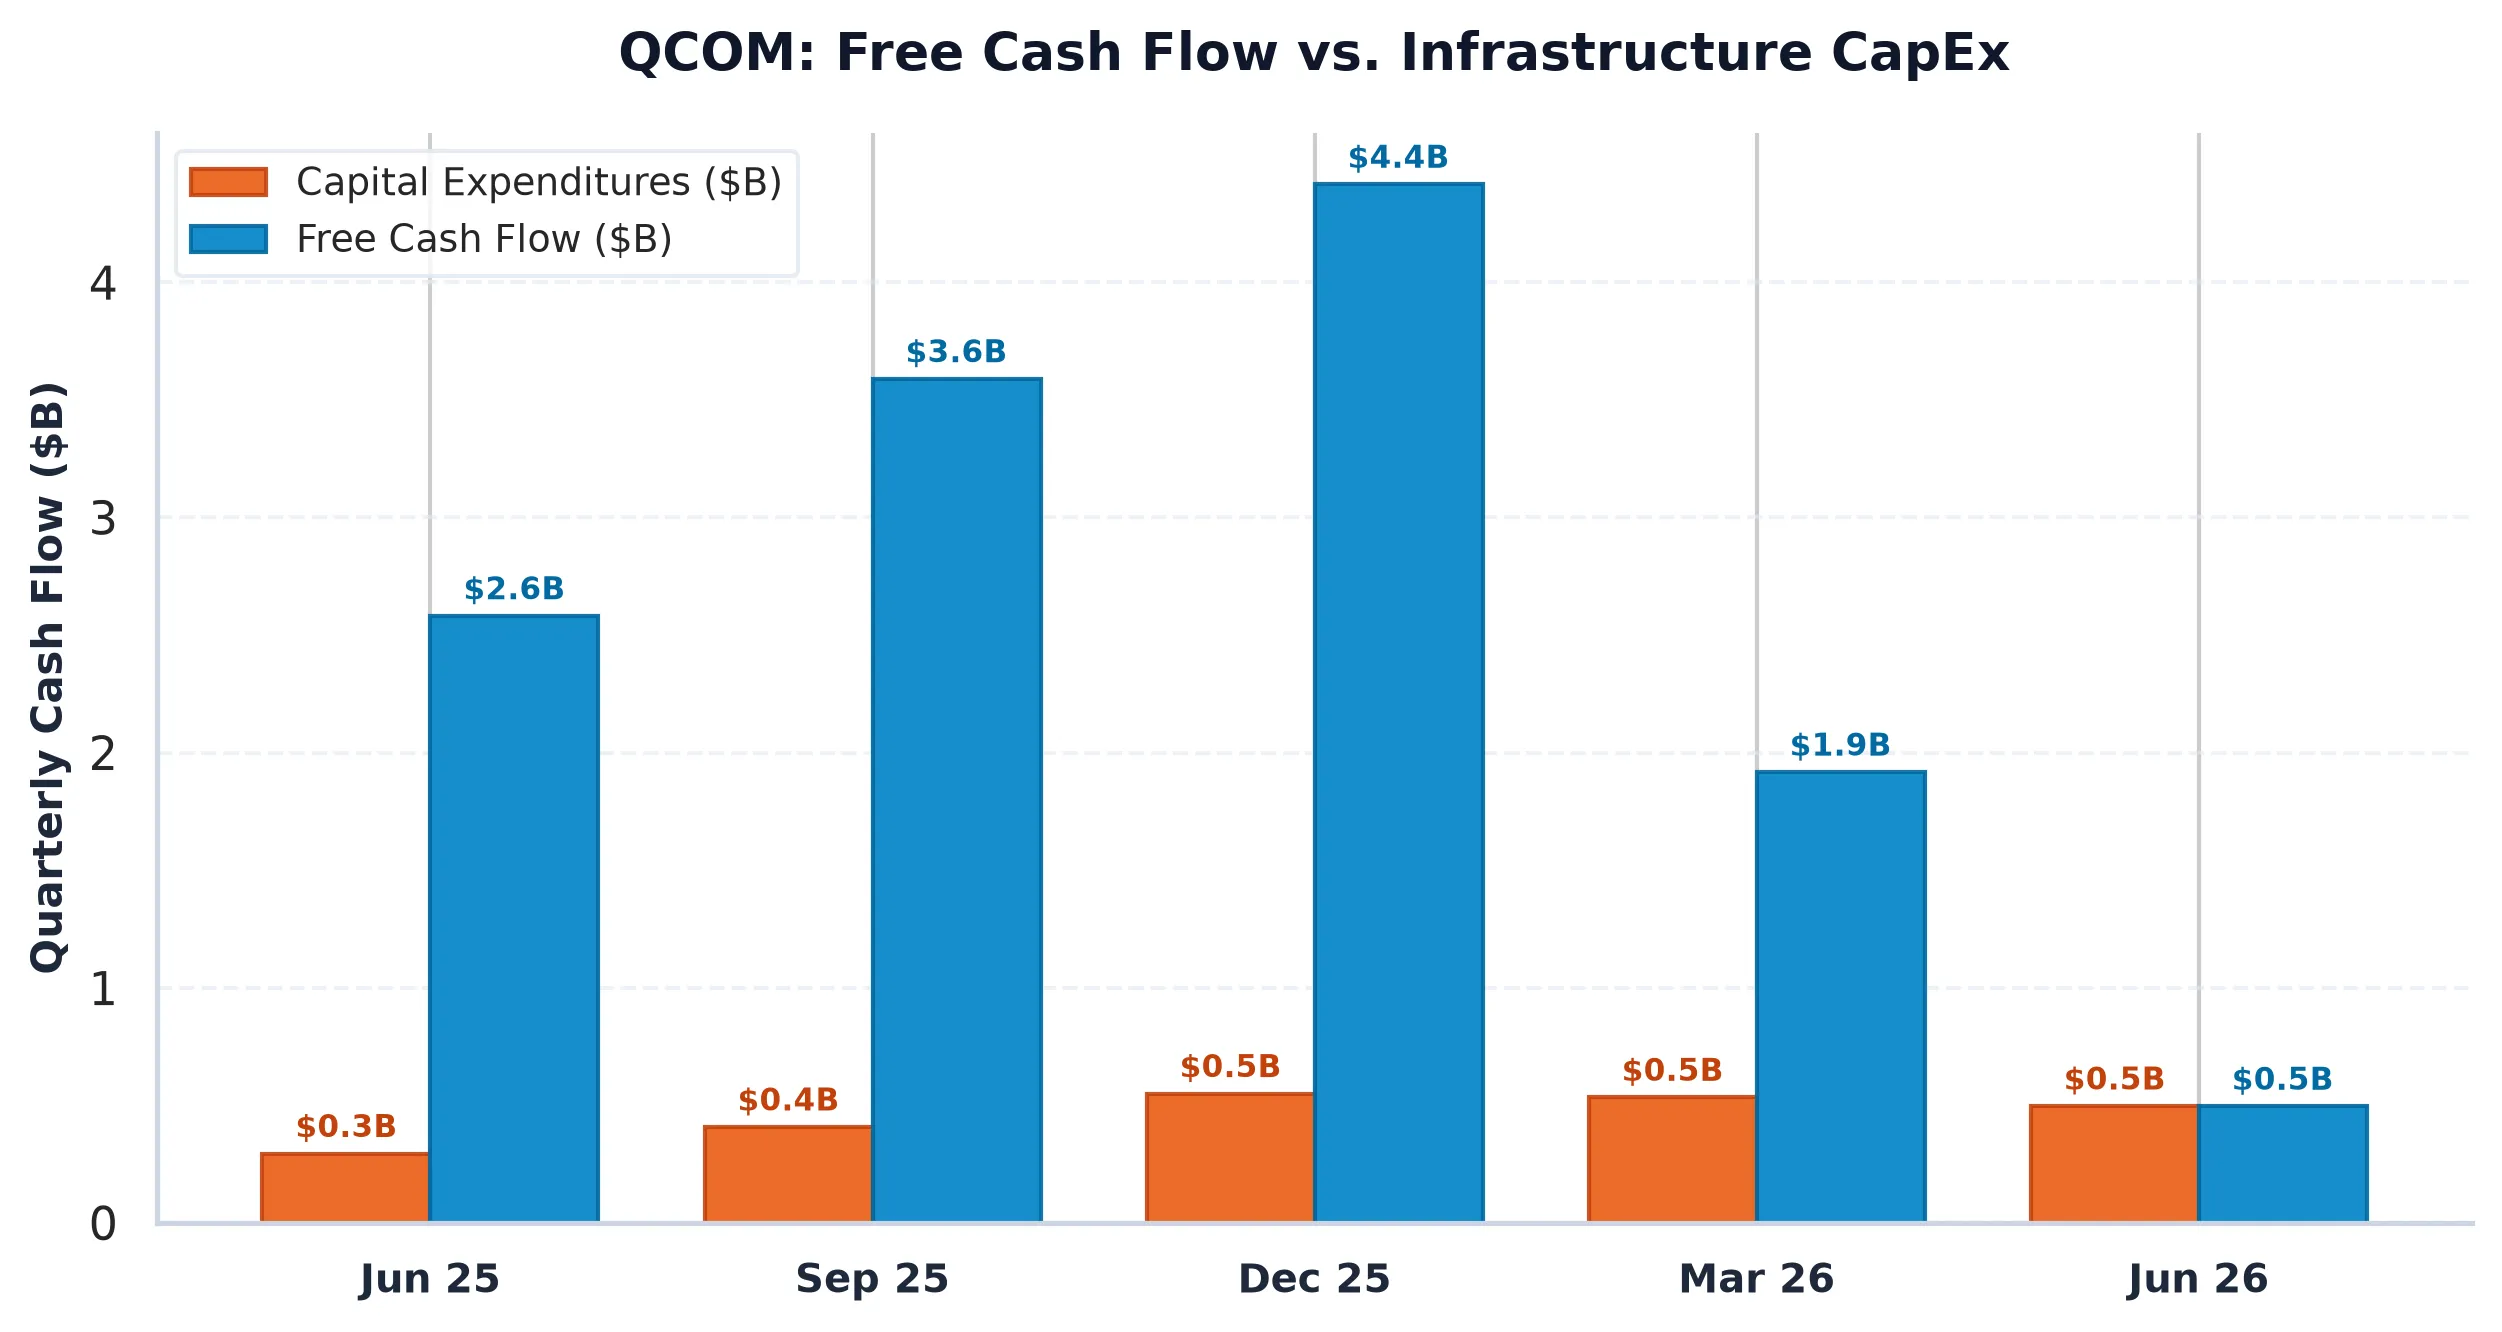
When a corporation spends billions on buybacks while simultaneously issuing significant stock-based compensation (SBC), the net effect is often a wash. The company is not so much returning capital to shareholders as it is laundering executive pay through the open market. With revenue growth currently sitting at -4.00% year over year, every dollar spent on offsetting dilution is a dollar that is not being used to pivot into the high-growth AI PC or automotive sectors. The capital intensity of the business remains high, with $2.16 billion in CapEx, meaning the margin for error in these buyback programs is narrowing.
The Quantitative Pin: Why $175 is the Gravity Well
While the fundamental analysts worry about the 0.46% yield spread, the options market has already decided where Qualcomm belongs for the immediate future. The current market structure for QCOM shows a massive Max Pain strike at $175.00. With the stock trading at $175.91, the price is effectively tethered to this level by dealer gamma hedging.
Options dealers are currently in a balanced position, but the proximity to the $175.00 strike suggests that any attempt at a breakout will be met with mechanical selling, while any dip will be met with mechanical buying as dealers adjust their hedges. The implied volatility stands at a hefty 50.11%, suggesting the market is bracing for a move of plus or minus $25.28 over the next 30 days. This high volatility combined with stagnant revenue growth creates a precarious situation for long-term holders. If the upcoming fiscal 2026 earnings release scheduled for early November fails to show a path back to positive growth, that $175 support wall could turn into a ceiling very quickly.
The TMT Pivot: AI PCs and the Revenue Gap
Qualcomm is attempting to reinvent itself as an AI company, moving beyond the modem and into the brain of the laptop. This is a capital-intensive transition. While the company maintains healthy gross margins of 54.23%, its operating margins of 18.53% reflect the heavy R&D burden required to compete with incumbents like Intel and AMD.
The problem for Qualcomm is timing. The smartphone market is mature and, as the -4.00% revenue growth suggests, currently in a period of digestion. The AI PC cycle is a multi-year story that has yet to show up in the net profit margin of 21.01%. Until that growth materializes, the stock remains a “duration” play: a bet that future cash flows will eventually justify a 20x trailing P/E in a world where you can get 5% for doing nothing.
For now, Qualcomm is a high-quality business with a fortress balance sheet (Net Debt/EBITDA of only 0.58x), but it is priced for a perfection that its current growth rates do not support. The shareholder treadmill is moving, but the company is still waiting for the next big gust of wind to move it forward.
QUALCOMM Incorporated (QCOM)
Trailing P/E
Marcus Wolfe Screen
Leverage Profile
30D Channel
Pristine cash flow conversion (2.53x) and healthy accrual ratio (-16.89%). Zero accounting anomalies detected (LOW ANOMALY RISK).
Manageable liability structure relative to institutional cash flow.
Evaluated against 5.10% US 10-Yr Benchmark (FCF Spread: +0.46% (vs 10Y Yield of 4.99%)).
Max Pain: $175.00 (-0.52%) | P/C Ratio: 0.87 | 30D Channel: $163.30 – $188.52.
$161.84 – $168.87 (-4% to -8% Pullback Accumulation)
Sustained weekly close below $158.32 (-10.0% structural stop) or fundamental cash flow deterioration.