
The consensus view on oilfield services is currently undergoing a violent, joyful upward revision. The narrative, as broadcast by the usual financial conduits, is that SLB N.V. (SLB) has successfully navigated the choppy waters of North American shale volatility by pivoting to the deepwater riches of the Middle East and offshore Brazil. On Friday, the company reported a third quarter earnings beat of two cents per share, sent revenue higher than the analysts expected, and watched its stock price climb nearly 7 percent in a single session. In the world of institutional equity research, this is what we call a clean sweep.
However, if you look past the immediate dopamine hit of a green candle on a Friday afternoon, the mechanical reality of the capital structure tells a slightly more complicated story. SLB N.V. (SLB) is a magnificent engineering firm that specializes in the incredibly difficult task of poking very precise holes in the earth, often under miles of saltwater. It is also, currently, a financial instrument that pays you significantly less than a risk-free government bond.
The math here is stubbornly uncooperative for the bulls. Based on recent filings, SLB generates a Free Cash Flow (FCF) yield of approximately 3.75 percent. Meanwhile, the US 10-Year Treasury yield sits at a sturdy 5.00 percent. This creates a negative equity risk premium of 1.25 percent. In simpler terms, you are paying the company for the privilege of taking on oil price volatility, geopolitical risk in the Permian and the Persian Gulf, and the massive capital intensity of deepwater drilling, all while earning 125 basis points less than you would by lending money to Uncle Sam.
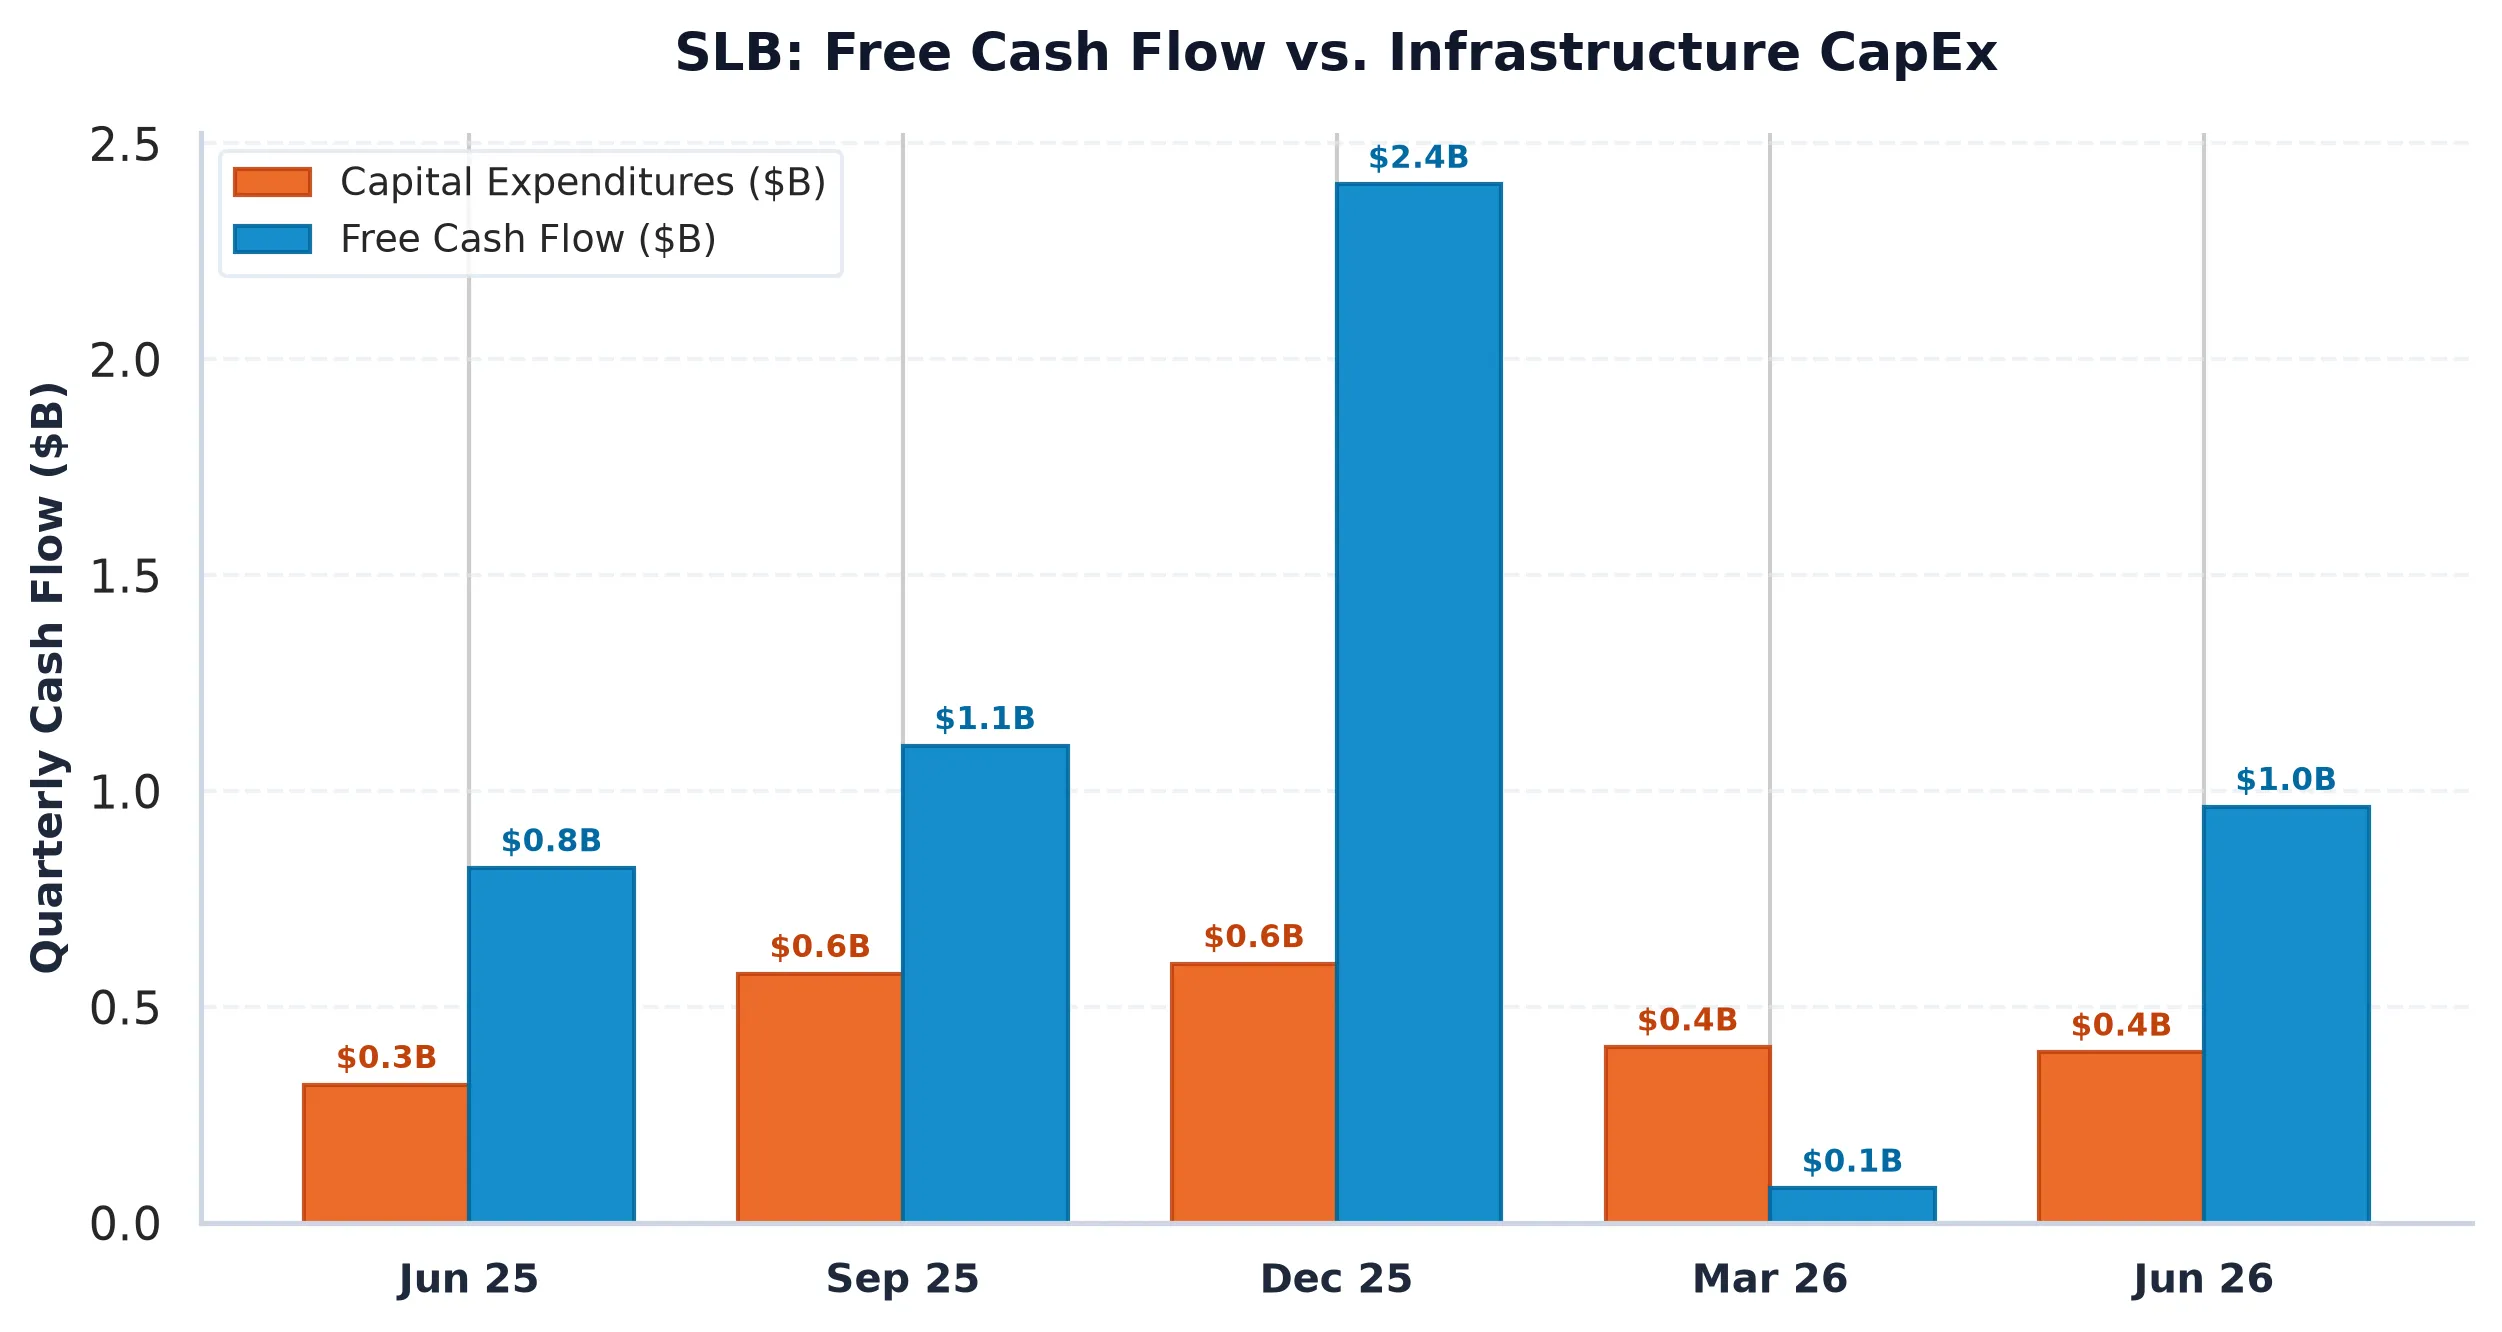
The company’s capital intensity is another point of friction. SLB spent $3.58 billion on capital expenditures over the last twelve months, representing nearly 10 percent of its total revenue. This is the treadmill of the service sector: to grow revenue by 5 percent, as SLB did year over year, you must continuously reinvest billions into high-tech drill bits and seismic software. When the cost of capital was near zero, this was a charming way to compound value. At a 5 percent risk-free rate, the hurdle for that reinvestment becomes a vertical wall.
If the fundamental spread is a bit chilly, the market plumbing is positively overheated. The options market for SLB N.V. (SLB) currently shows a Put/Call Open Interest ratio of 0.58. For those who do not spend their weekends staring at dealer hedging profiles, this means there are nearly twice as many calls as puts. The market is leaning heavily into the “recovery” trade.
This speculative long skew creates a specific kind of mechanical danger. As the stock surged toward $53.19, it blew past major Call Walls at $51 and $52. Options dealers, who sell these calls to the public, must buy the underlying stock to hedge their exposure. This creates a reflexive feedback loop that drives the price higher. But this process is finite. With the Max Pain strike sitting way down at $49.50, nearly 7 percent below the current price, the gravity of the options expiration cycle is starting to look quite heavy. If the upward momentum pauses for even a moment, those same dealers will begin selling their hedges, potentially turning Friday’s breakout into Monday’s trap.
The official 8-K filing from October 23, 2026, confirms that the Middle East is indeed the engine of growth, with international revenue far outpacing domestic trends. But the market has already priced this “rebound” into a valuation that offers no margin of safety relative to the bond market. SLB is a world-class operator, but at these levels, it is a crowded trade built on the hope that the 10-Year Treasury will eventually stop making equity yields look so inadequate.
| Metric | Value |
|---|---|
| AllWallSt Investment Verdict | HOLD |
| Current Price | $53.165 |
| FCF Yield vs. 10Y Spread | -1.25% |
| Put/Call OI Ratio | 0.58 |
| 30-Day Expected Move | +/- 5.82% |
SLB N.V. (SLB)
Trailing P/E
Marcus Wolfe Screen
Leverage Profile
30D Channel
Pristine cash flow conversion (1.92x) and healthy accrual ratio (-5.68%). Zero accounting anomalies detected (LOW ANOMALY RISK).
Manageable liability structure relative to institutional cash flow.
Evaluated against 5.10% US 10-Yr Benchmark (FCF Spread: -1.25% (vs 10Y Yield of 5.00%)).
Max Pain: $49.50 (-6.93%) | P/C Ratio: 0.58 | 30D Channel: $49.35 – $56.98.
$48.91 – $51.04 (-4% to -8% Pullback Accumulation)
Sustained weekly close below $47.85 (-10.0% structural stop) or fundamental cash flow deterioration.