
The current consensus narrative surrounding Tesla, Inc. (TSLA) is that the upcoming Q3 earnings report is merely a bridge to a more exciting, perhaps airborne, future. Between whispers of merger speculation and the promise of a flying Roadster, the market has successfully distracted itself from the mundane reality of selling four-wheeled terrestrial vehicles. If you can convince investors to look at the sky, they are much less likely to look at the operating margin.
This is a classic Tesla maneuver. When the core business of manufacturing cars at scale becomes difficult, the narrative shifts to something that does not yet require a factory. The problem, as it usually is in a world where the 10-Year Treasury yield sits at 5.11%, is that the math for terrestrial businesses eventually catches up to the orbital valuations.
The Negative Yield Gap
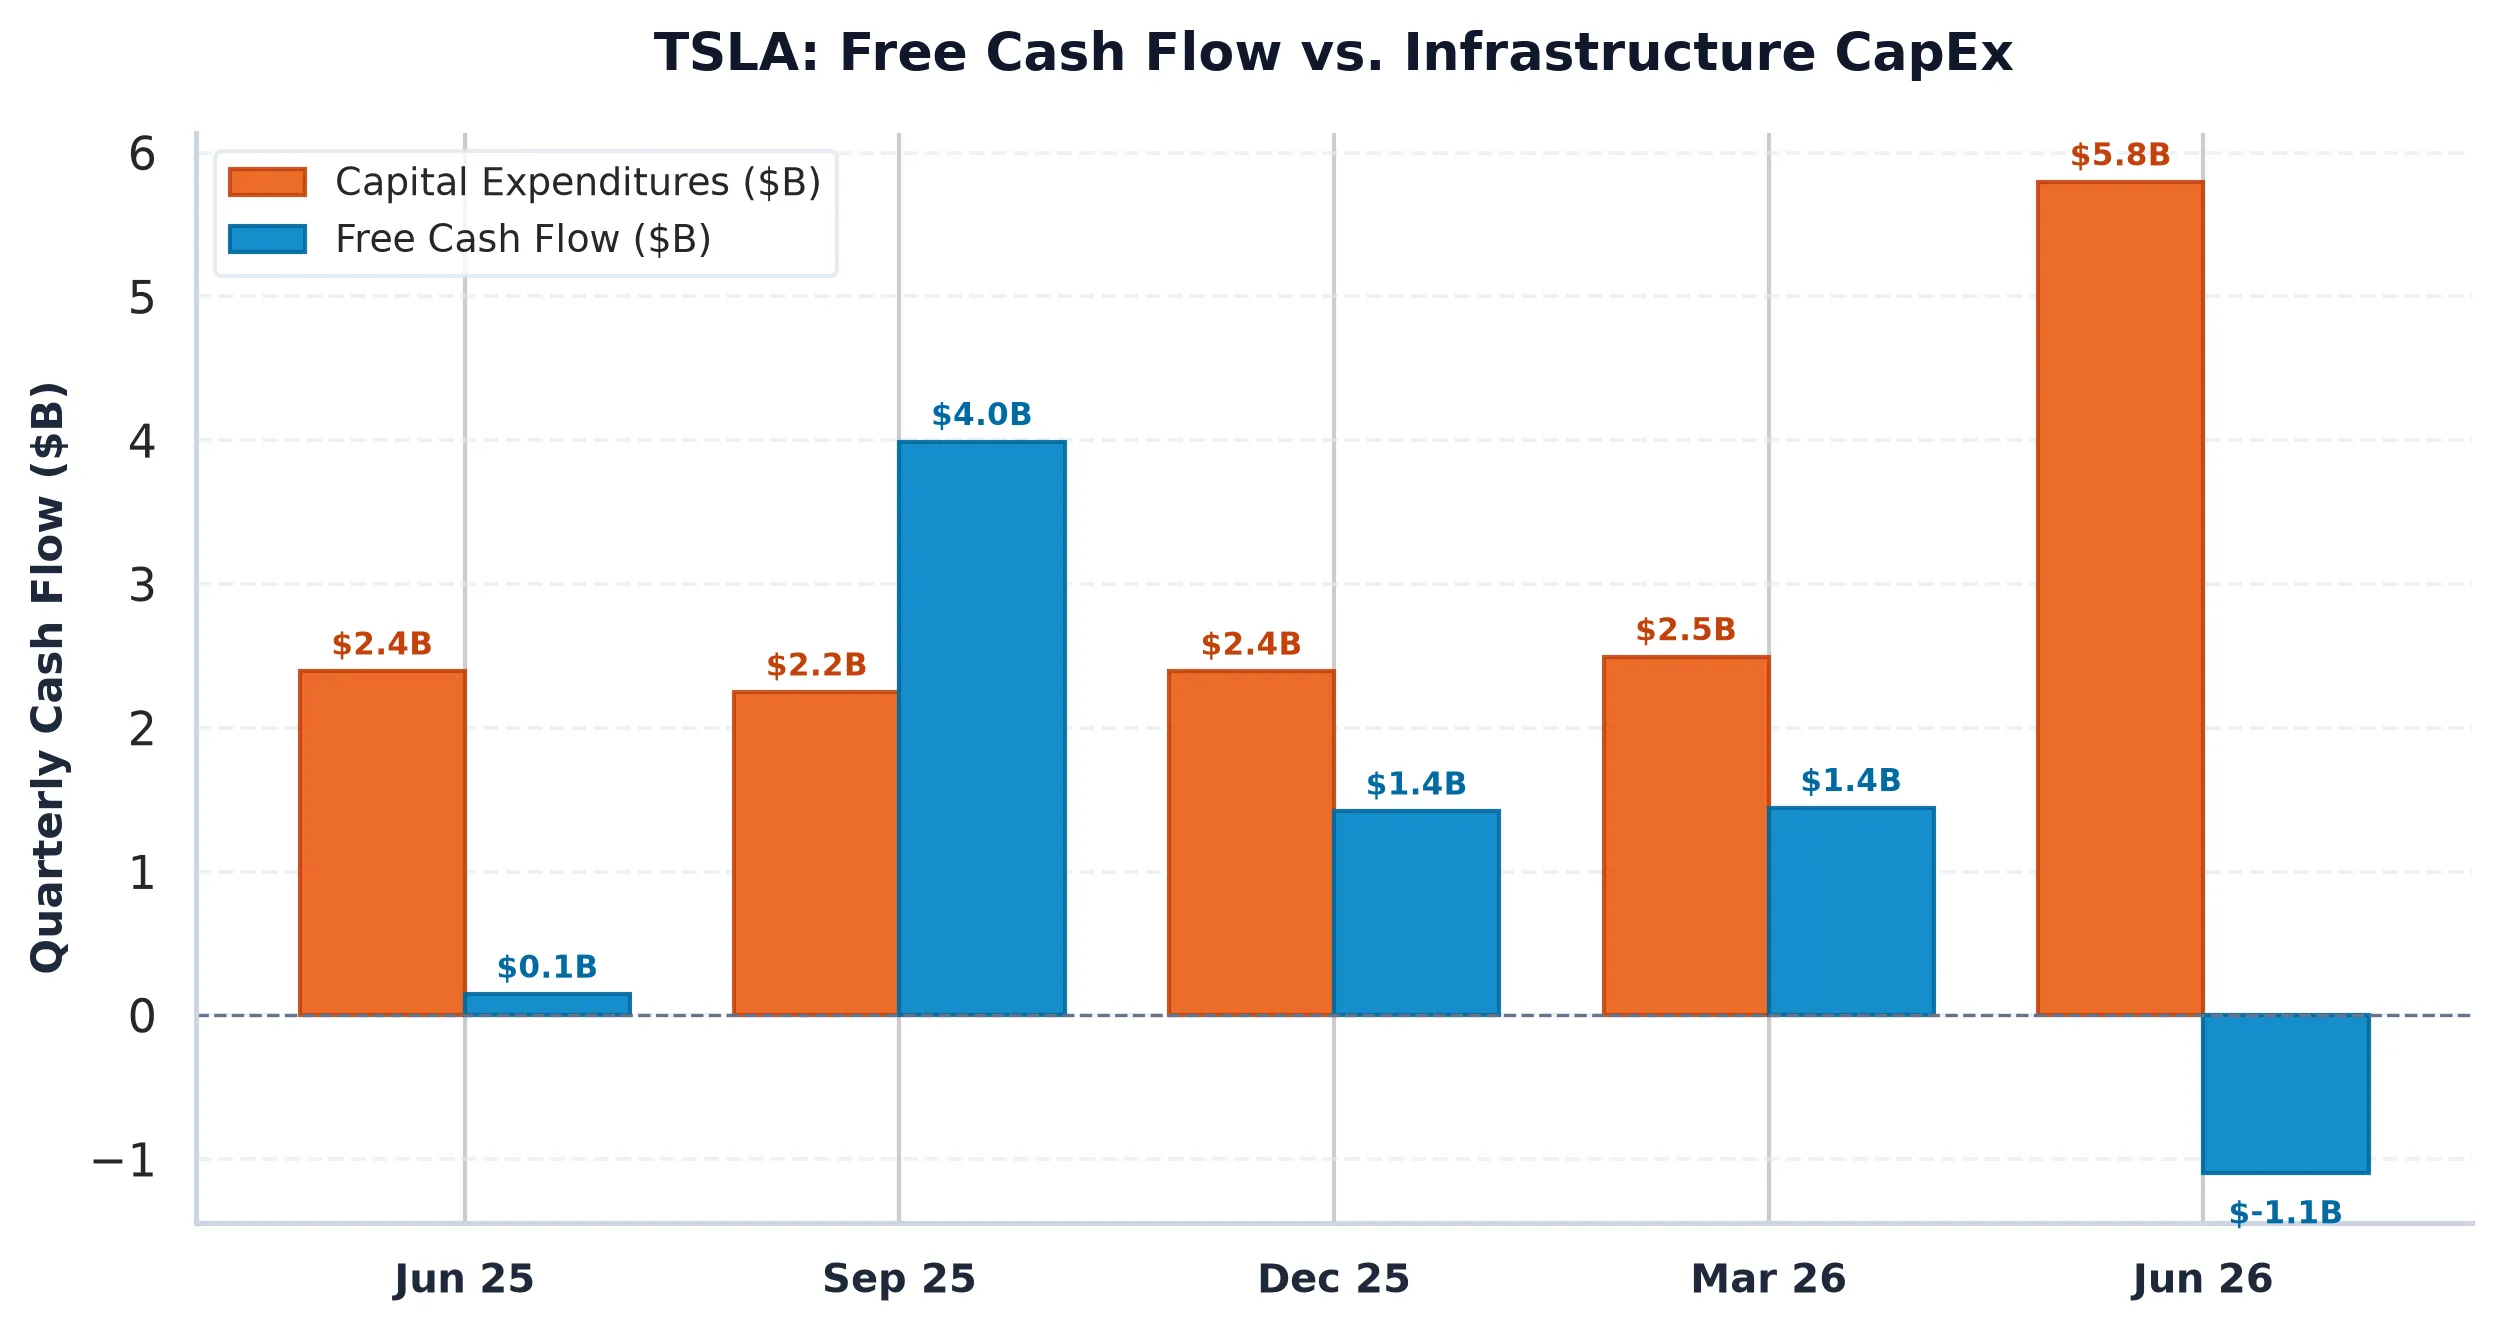
Tesla, Inc. (TSLA) currently carries a market capitalization of approximately $1.53 trillion. To justify that number, one generally looks for a significant stream of cash being returned to shareholders or reinvested at high rates of return. According to recent SEC filings, specifically the Form 10-Q filed on July 23, 2026, the company is indeed reinvesting. CapEx intensity is high at 13.37%, representing a $13.85 billion spend.
However, the efficiency of that spend is under pressure. The company’s operating margin has compressed to 1.41%. For context, that is not the margin of a high-flying software enterprise: it is the margin of a company that has to pay for steel, lithium, and massive amounts of electricity.
The most striking figure is the Free Cash Flow (FCF) yield. At 0.32%, Tesla provides almost no immediate cash return relative to its price. When compared to the risk-free rate of 5.11%, the equity risk premium is a staggering negative 4.79%. Effectively, an investor is paying Tesla a massive premium for the privilege of ignoring a 5% yield from the US government.
The $365 Gravity Well
While the fundamental analysts debate whether a car can actually fly, the options market is busy doing the plumbing. Current market structure data reveals a significant tension between retail enthusiasm and institutional positioning.
The Put/Call Open Interest ratio stands at 0.88, which is relatively balanced, but the overhead resistance is formidable. There is a primary Call Wall at $400 with over 18,500 contracts. This acts as a structural ceiling. Dealers who have sold those calls must buy the underlying stock as it rises, but as the price approaches $400, the incentive to hedge further diminishes, often causing rallies to stall.
More importantly, the Max Pain strike is currently pinned at $365. This is the price level where the greatest number of options contracts expire worthless. In the lead-up to earnings, the market often exhibits a magnetic pull toward this level as dealers adjust their hedges. With the stock currently trading near $386, the mathematical gravity of the $365 strike suggests a 5.65% downside risk purely from market positioning, regardless of what the CEO says about the Roadster.
Falling Profits vs. Rising Expectations
The recent 48-hour news cycle highlights a “Q3 preview” of flat revenue and falling profits. This is a difficult backdrop for a stock trading at a forward P/E of 178x. Usually, when you pay 178 times earnings, you expect those earnings to be growing rapidly, not contracting.
Tesla’s net profit margin of 3.67% and Return on Equity of 4.67% suggest that the business is currently earning less on its capital than a passive investor could earn in a money market fund. The company does maintain a healthy net cash surplus of $27.44 billion, which provides a significant cushion, but cash on a balance sheet is a defensive asset, not a growth engine.
If the Q3 results confirm the trend of margin compression, the “Consensus Check” suggests that the narrative of Tesla as an AI and robotics company will be tested. It is much easier to value a robotics company at 178x earnings when you don’t have to account for the declining margins of the car company that is funding the robots.
Tesla, Inc. (TSLA)
Trailing P/E
Marcus Wolfe Screen
Leverage Profile
30D Channel
Pristine cash flow conversion (3.89x) and healthy accrual ratio (-7.95%). Zero accounting anomalies detected (LOW ANOMALY RISK).
Fortress Balance Sheet (Net Cash Position; zero net refinancing distress).
Evaluated against 5.10% US 10-Yr Benchmark (FCF Spread: -4.79% (vs 10Y Yield of 5.11%)).
Max Pain: $365.00 (-5.65%) | P/C Ratio: 0.88 | 30D Channel: $359.12 – $414.58.
$355.90 – $371.38 (-4% to -8% Pullback Accumulation)
Sustained weekly close below $348.16 (-10.0% structural stop) or fundamental cash flow deterioration.