
The $1.5 Trillion Gamma Engine: Inside Tesla’s 350x Multiple in a 5.3% Yield World
There is an old, quaint rule in corporate finance that says a company is worth the present value of its future cash flows, discounted at an appropriate cost of capital. When the 10-year US Treasury yield rises to 5.28% and real yields press against multi-cycle highs, that discount rate is supposed to bite. High-duration promises of distant cash flows become expensive, and multiples contract.
Unless, apparently, you happen to be Tesla.
As of Thursday morning, Tesla trades at $377.81 per share, giving the company a market capitalization of $1.49 trillion and an enterprise value of $1.47 trillion. To justify that valuation on traditional multiples, one might expect software-monopoly margins, prodigious free cash generation, or at least a modest cost of capital advantage.
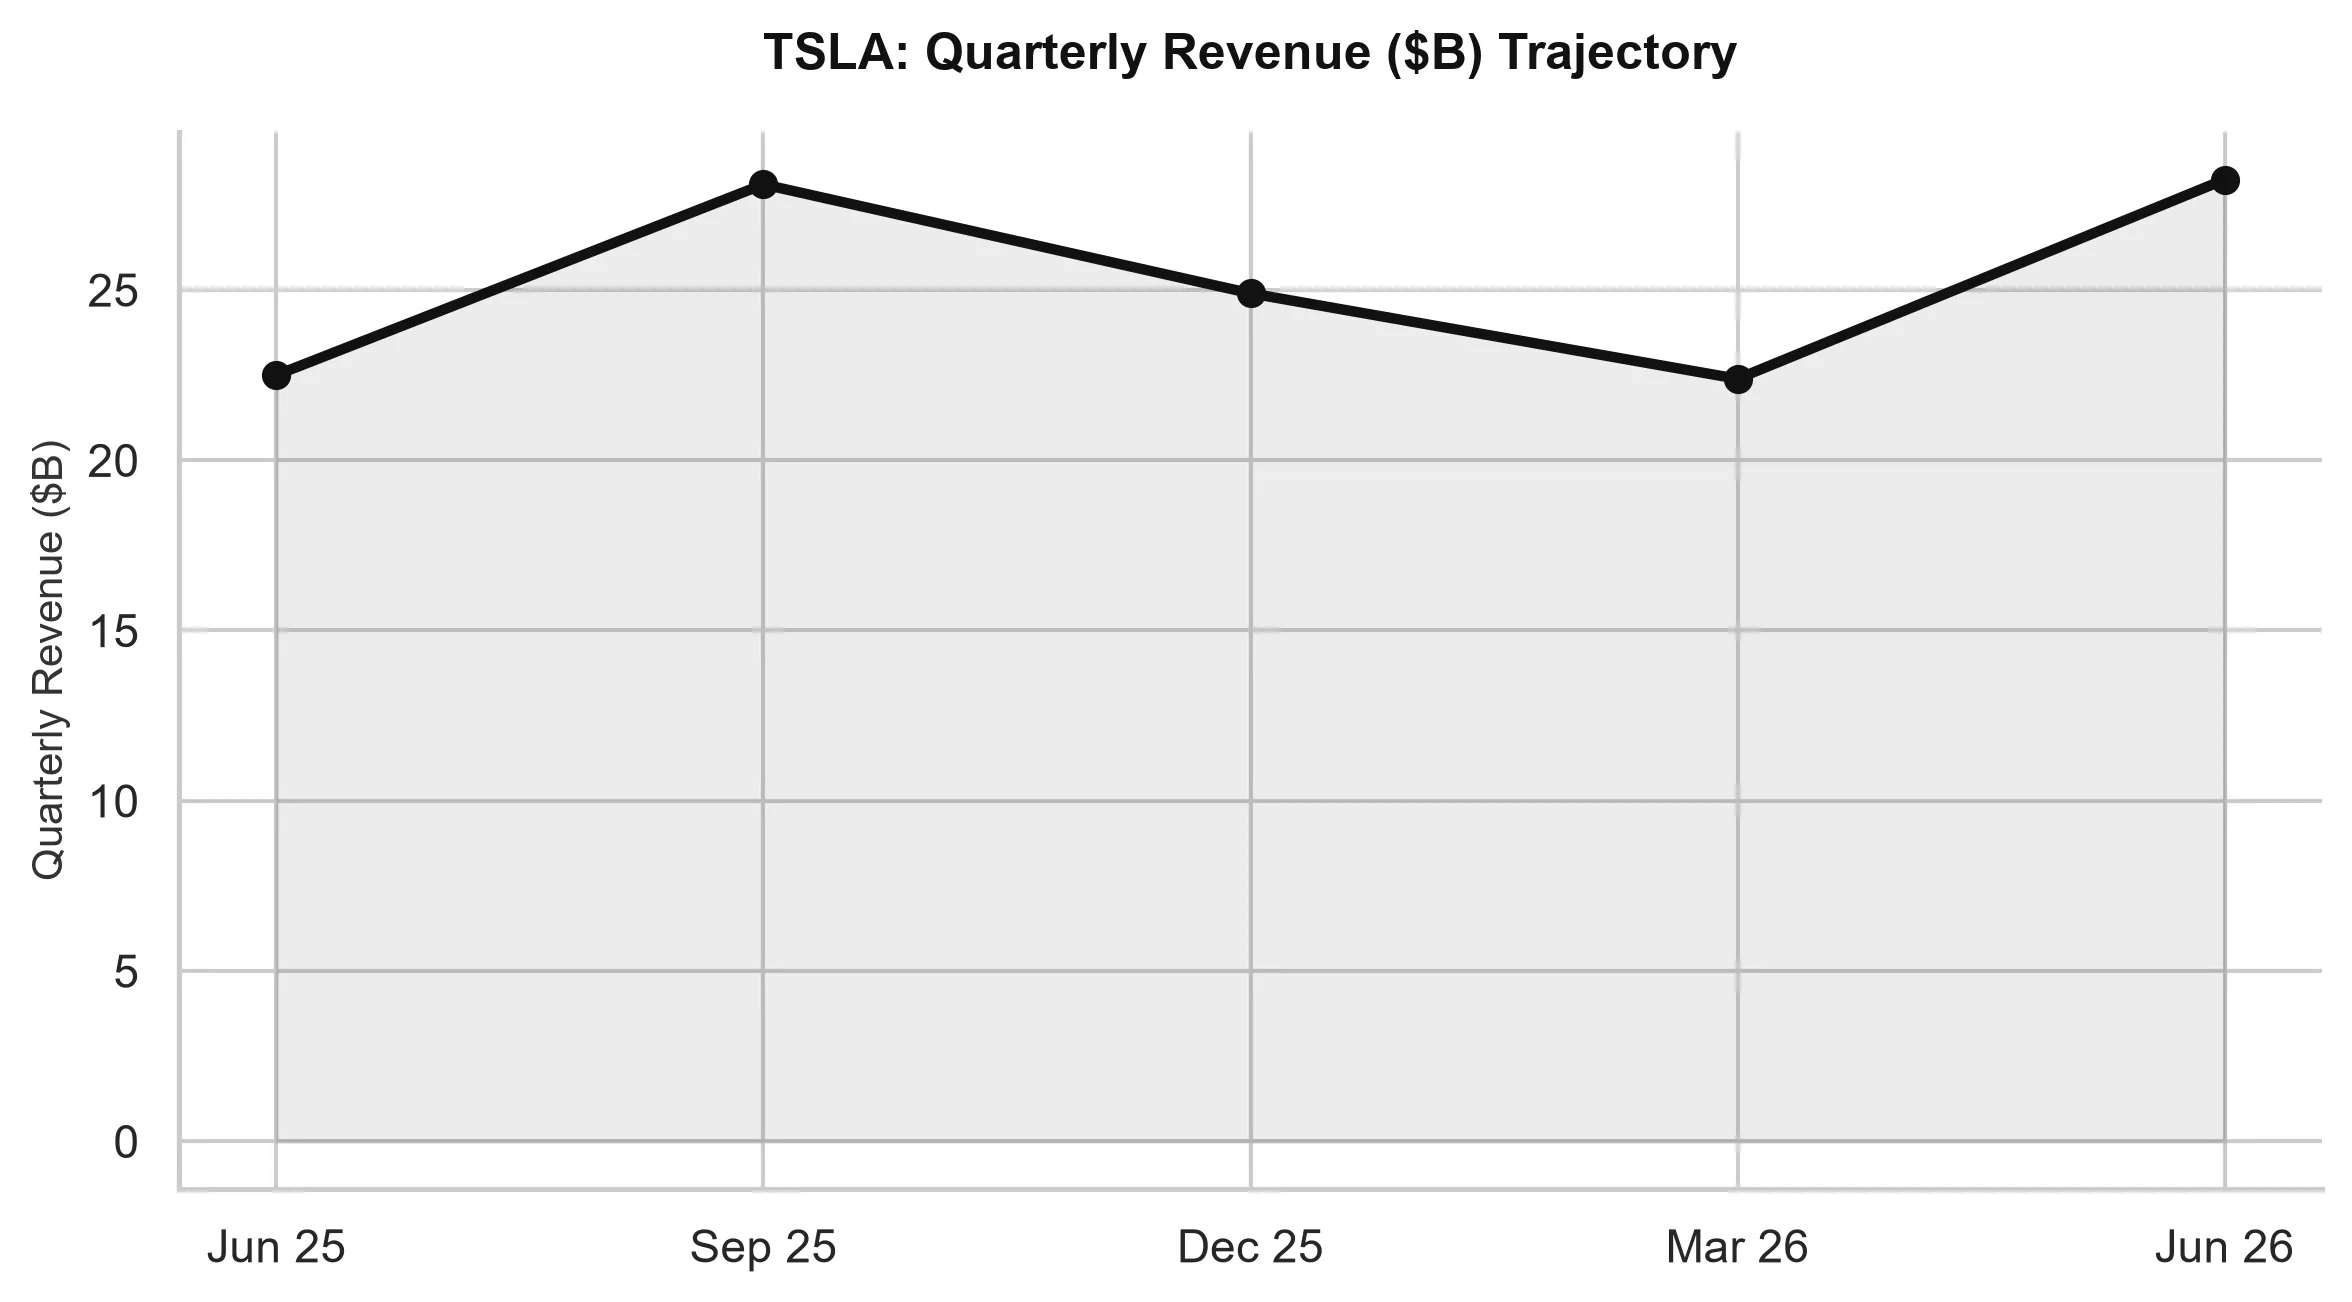
Instead, Tesla’s latest twelve-month financial statements show total revenue of $103.62 billion, net income of $3.81 billion, and an operating margin of precisely 1.41%.
That translates to a trailing price-to-earnings multiple of 349.82x, an EV-to-EBITDA multiple of 136.25x, and a forward P/E multiple of 176.16x. To put those numbers in perspective, the broader Technology sector trades at 32.98x trailing earnings, while the Consumer Discretionary benchmark trades at 24.56x. Tesla is not simply trading at a premium to automakers; it is trading at a ten-fold multiple premium to enterprise software monopolies, while earning automotive manufacturing margins.
Understanding why requires stepping away from traditional discounted cash flow spreadsheets and examining the actual mechanics driving the price action: cross-asset macro liquidity, options market structure, and retail flow plumbing.
The Macro Note: The Liquidity Squeeze and the Rate Wall
The broader macroeconomic tape is not providing an easy tailwind for risk assets.
Across global desks, the morning prints reflect a tightening liquidity environment:
- Rates at the Frontier: The 10-Year US Treasury yield (^TNX) sits at 5.277%, holding near its 52-week peak of 5.35%. Long-dated sovereign debt remains heavy, with the iShares 20+ Year Treasury Bond ETF (TLT) hovering at $77.15, right above its annual low of $76.43.
- The Dollar Headwind: The US Dollar Index Bullish Fund (UUP) pushed higher to $29.04, touching its 52-week high of $29.08. A resurgent dollar systematically tightens offshore dollar liquidity and compresses multinational corporate revenues.
- Small-Cap Deterioration: While mega-cap benchmarks showed modest softness, with the S&P 500 (SPY) off 0.24% at $777.22 and the Nasdaq 100 (QQQ) down 0.25% at $757.73, the Russell 2000 (IWM) tumbled 1.29% to $277.70. Breadth is deteriorating rapidly.
- Volatility Awakening: The CBOE Volatility Index (^VIX) surged 5.90% to 15.97, reflecting rising demand for short-term downside protection.
- Commodity Pressures: Gold slipped 1.67% to $375.88, while crude oil (USO) drifted down 0.69% to $143.91.
In a normal market structure, elevated 5.28% benchmark yields create severe gravity for high-multiple growth equities. Small caps are feeling the brunt of refinancing costs. Yet mega-cap liquidity funnels have decoupled from the broader economy, congregating inside select single-stock derivatives ecosystems where market makers are held hostage by the options book.
Quantitative Flow Breakdown: The Options Gamma Vise
To understand why Tesla can trade at 350 times earnings while its operating margin is 1.41%, you have to talk to institutional derivatives desks rather than equity research analysts.
Tesla is not traded primarily as an automobile manufacturer or an energy utility. It is traded as the primary liquid derivative casino of the Western financial system.
1. The Call Wall Pin at $380
Options open interest across the current weekly and monthly expiration cycles shows an overwhelming concentration of call delta clustered between the $375, $380, and $400 strikes. When retail and quantitative systematic momentum funds buy short-dated out-of-the-money call options, options market makers who sell those contracts take on short gamma exposure.
To hedge their short call positions, dealers must purchase underlying shares of Tesla as the stock rallies toward the strike. This creates a mechanical feedback loop:
* Buying pushes the stock toward $380.
* Delta increases, forcing market makers to buy more underlying stock to remain delta-neutral.
* The stock is sucked upward toward the highest open interest strike, creating an artificial price pin that defies fundamental valuation metrics.
2. 0DTE Volatility Dampening and Sudden Voids
The proliferation of zero-days-to-expiration (0DTE) contracts has amplified this dynamic. Intraday dealer positioning in Tesla creates intense volatility dampening as long as the price stays within the heavy gamma pocket ($370 to $385).
However, because gamma flips rapidly as expiration approaches, any exogenous macro shock that pushes Tesla below key dealer support (the $365 put wall) forces those same market makers to aggressively liquidate stock to de-hedge. The very mechanism that supports the $1.49 trillion valuation creates severe, air-pocket downside asymmetry if the gamma support band gives way.
Sector Deep-Dive: The 1.4% Operating Margin Reality
Beneath the derivatives mechanics sits the physical business of building, shipping, and selling automobiles.
Here are the Fundamental baseline figures:
| Metric | Tesla Value | Sector Benchmark (XLY) | Tech Benchmark (XLK) |
|---|---|---|---|
| Share Price | $377.81 | $111.36 | $201.39 |
| Market Capitalization | $1.49 Trillion | N/A | N/A |
| Trailing P/E | 349.82x | 24.56x | 32.98x |
| Forward P/E | 176.16x | N/A | N/A |
| EV / EBITDA | 136.25x | 13.20x | 21.40x |
| Gross Margin | 18.85% | 35.10% | 49.20% |
| Operating Margin | 1.41% | 11.80% | 24.50% |
| Net Profit Margin | 3.67% | 7.90% | 21.10% |
| Return on Equity (ROE) | 4.67% | 18.20% | 29.40% |
| Free Cash Flow | $4.84 Billion | N/A | N/A |
The contrast between narrative and unit economics is stark. While the market assigns Tesla a $1.49 trillion valuation, representing an enterprise value to revenue multiple of 14.14x, the company generates a gross margin of 18.85% and converts only 1.41% of its revenue into operating income.
In automotive manufacturing, global competitors face relentless price competition, rising dealer inventories, and stubborn battery supply costs. Tesla’s price cuts over the past 24 months successfully protected volume, revenue grew 25.50% year-over-year to $103.62 billion, but at a severe cost to profitability.
A company earning a 1.41% operating margin has very little operational buffer against rising component costs, wage inflation, or localized consumer demand slowdowns. When a business trades at 350x earnings, the market is pricing perfection in autonomous driving, humanoid robotics, and distributed energy. If those non-automotive high-margin revenues do not materialize rapidly, the automotive core cannot support the current market capitalization.
Forensic Risk Spotlight: Working Capital, Credits, and Accruals
A forensic examination of Tesla’s balance sheet and statement of cash flows reveals several structural nuances that institutional investors must track:
1. Operating Cash Flow Conversion Divergence
On the surface, Tesla’s cash generation appears robust. Operating cash flow clocked in at $14.75 billion against GAAP net income of $3.81 billion, resulting in a cash flow conversion ratio of 3.89x and negative total accruals of -$10.95 billion.
In forensic accounting screens, negative accruals indicate that reported earnings are backed by actual cash inflows rather than paper accounting receivables. However, the composition of that cash flow requires scrutiny:
* Regulatory Credits: A non-trivial portion of operating profit remains tied to regulatory automotive credit sales, which carry near-100% gross margins and are paid by legacy automakers. As global OEMs ramp electric vehicle production to meet emissions standards, credit purchase obligations will inevitably shrink.
* Working Capital Swings: Inventory balances and accounts payable cycles contributed significantly to cash timing differences. While accounts receivable did not outpace revenue growth, inventory turns require close surveillance as production capacity expands across global gigafactories.
2. Balance Sheet Cushion vs. Capital Efficiency
Tesla maintains a substantial liquidity fortress:
* Total Cash & Short-Term Investments: $43.52 billion
* Total Debt: $16.08 billion
* Net Cash Position: $27.44 billion
With $27.44 billion in net cash, Tesla faces zero near-term solvency or refinancing risk, even with 10-year Treasury yields at 5.28%. But having cash on the balance sheet is distinct from generating high returns on capital. With return on equity standing at just 4.67%, Tesla is currently generating returns on invested capital that barely match the risk-free return of the 10-year Treasury note.
The Strategic Takeaway
Tesla currently exists in two parallel dimensions:
- The Fundamentals Dimension: An elite, scaled industrial manufacturer with $103.6 billion in revenue, $43.5 billion in cash, and a pristine balance sheet, but burdened by an automotive business model that produces a 1.4% operating margin and a 4.7% ROE.
- The Market Structure Dimension: A $1.49 trillion options collateral asset whose day-to-day valuation is governed by dealer gamma hedging, 0DTE retail call volume, and passive index flows that disregard traditional discount rates.
As long as options volume remains dominated by upside call demand, dealer mechanics can hold Tesla pinned well above its fundamental automotive baseline. But in a macro environment where benchmark yields remain locked at 5.28%, the US dollar sits at multi-month highs, and market breadth is cracking, the margin for error is razor-thin.
When a stock trades at 350x trailing earnings, any breakdown in dealer gamma positioning will force investors to confront the underlying spreadsheet. And at a 1.4% operating margin, that spreadsheet is unforgiving.
Tesla, Inc. (TSLA)
Trailing P/E
Marcus Wolfe Screen
Leverage Profile
30D Channel
Pristine cash flow conversion (3.89x) and healthy accrual ratio (-7.95%). Zero accounting anomalies detected (LOW ANOMALY RISK).
Fortress Balance Sheet (Net Cash Position; zero net refinancing distress).
Evaluated against 5.10% US 10-Yr Benchmark (FCF Spread: -4.75% (vs 10Y Yield of 5.10%)).
Max Pain: $367.50 (+3.60%) | P/C Ratio: 0.62 | 30D Channel: $329.30 – $380.14.
$326.34 – $340.53 (-4% to -8% Pullback Accumulation)
Sustained weekly close below $319.25 (-10.0% structural stop) or fundamental cash flow deterioration.