
The Nuclear Tollbooth Illusion: Inside Constellation Energy’s $105 Billion AI Multiple and $6.6 Billion Cash Burn
If you turn on financial television or open a research note from any major investment bank this afternoon, the story sounds almost too elegant to doubt. Artificial intelligence models require staggering quantities of electricity. Hyperscalers have pledged to reach net-zero carbon emissions. Wind and solar are intermittent, batteries cannot bridge multi-day lulls, and building new natural gas plants invites regulatory protest. Therefore, Big Tech must buy nuclear power, whatever the price.
Enter Constellation Energy (NASDAQ: CEG). When the company announced an exclusive 20-year agreement with Microsoft to resurrect Unit 1 of Three Mile Island (rebranded with immaculate public-relations precision as the Crane Clean Energy Center), the market crowned it the essential gatekeeper of the digital future.
Over the past year, shares of Constellation have surged past $298, pushing its market capitalization beyond $105 billion. At a trailing price-to-earnings multiple of 29.2x and an enterprise value of $125.4 billion, equity markets have effectively reclassified a capital-intensive merchant power generator into a hyper-growth enterprise software provider.
There is only one problem with this breathless consensus trade: the actual financial plumbing.
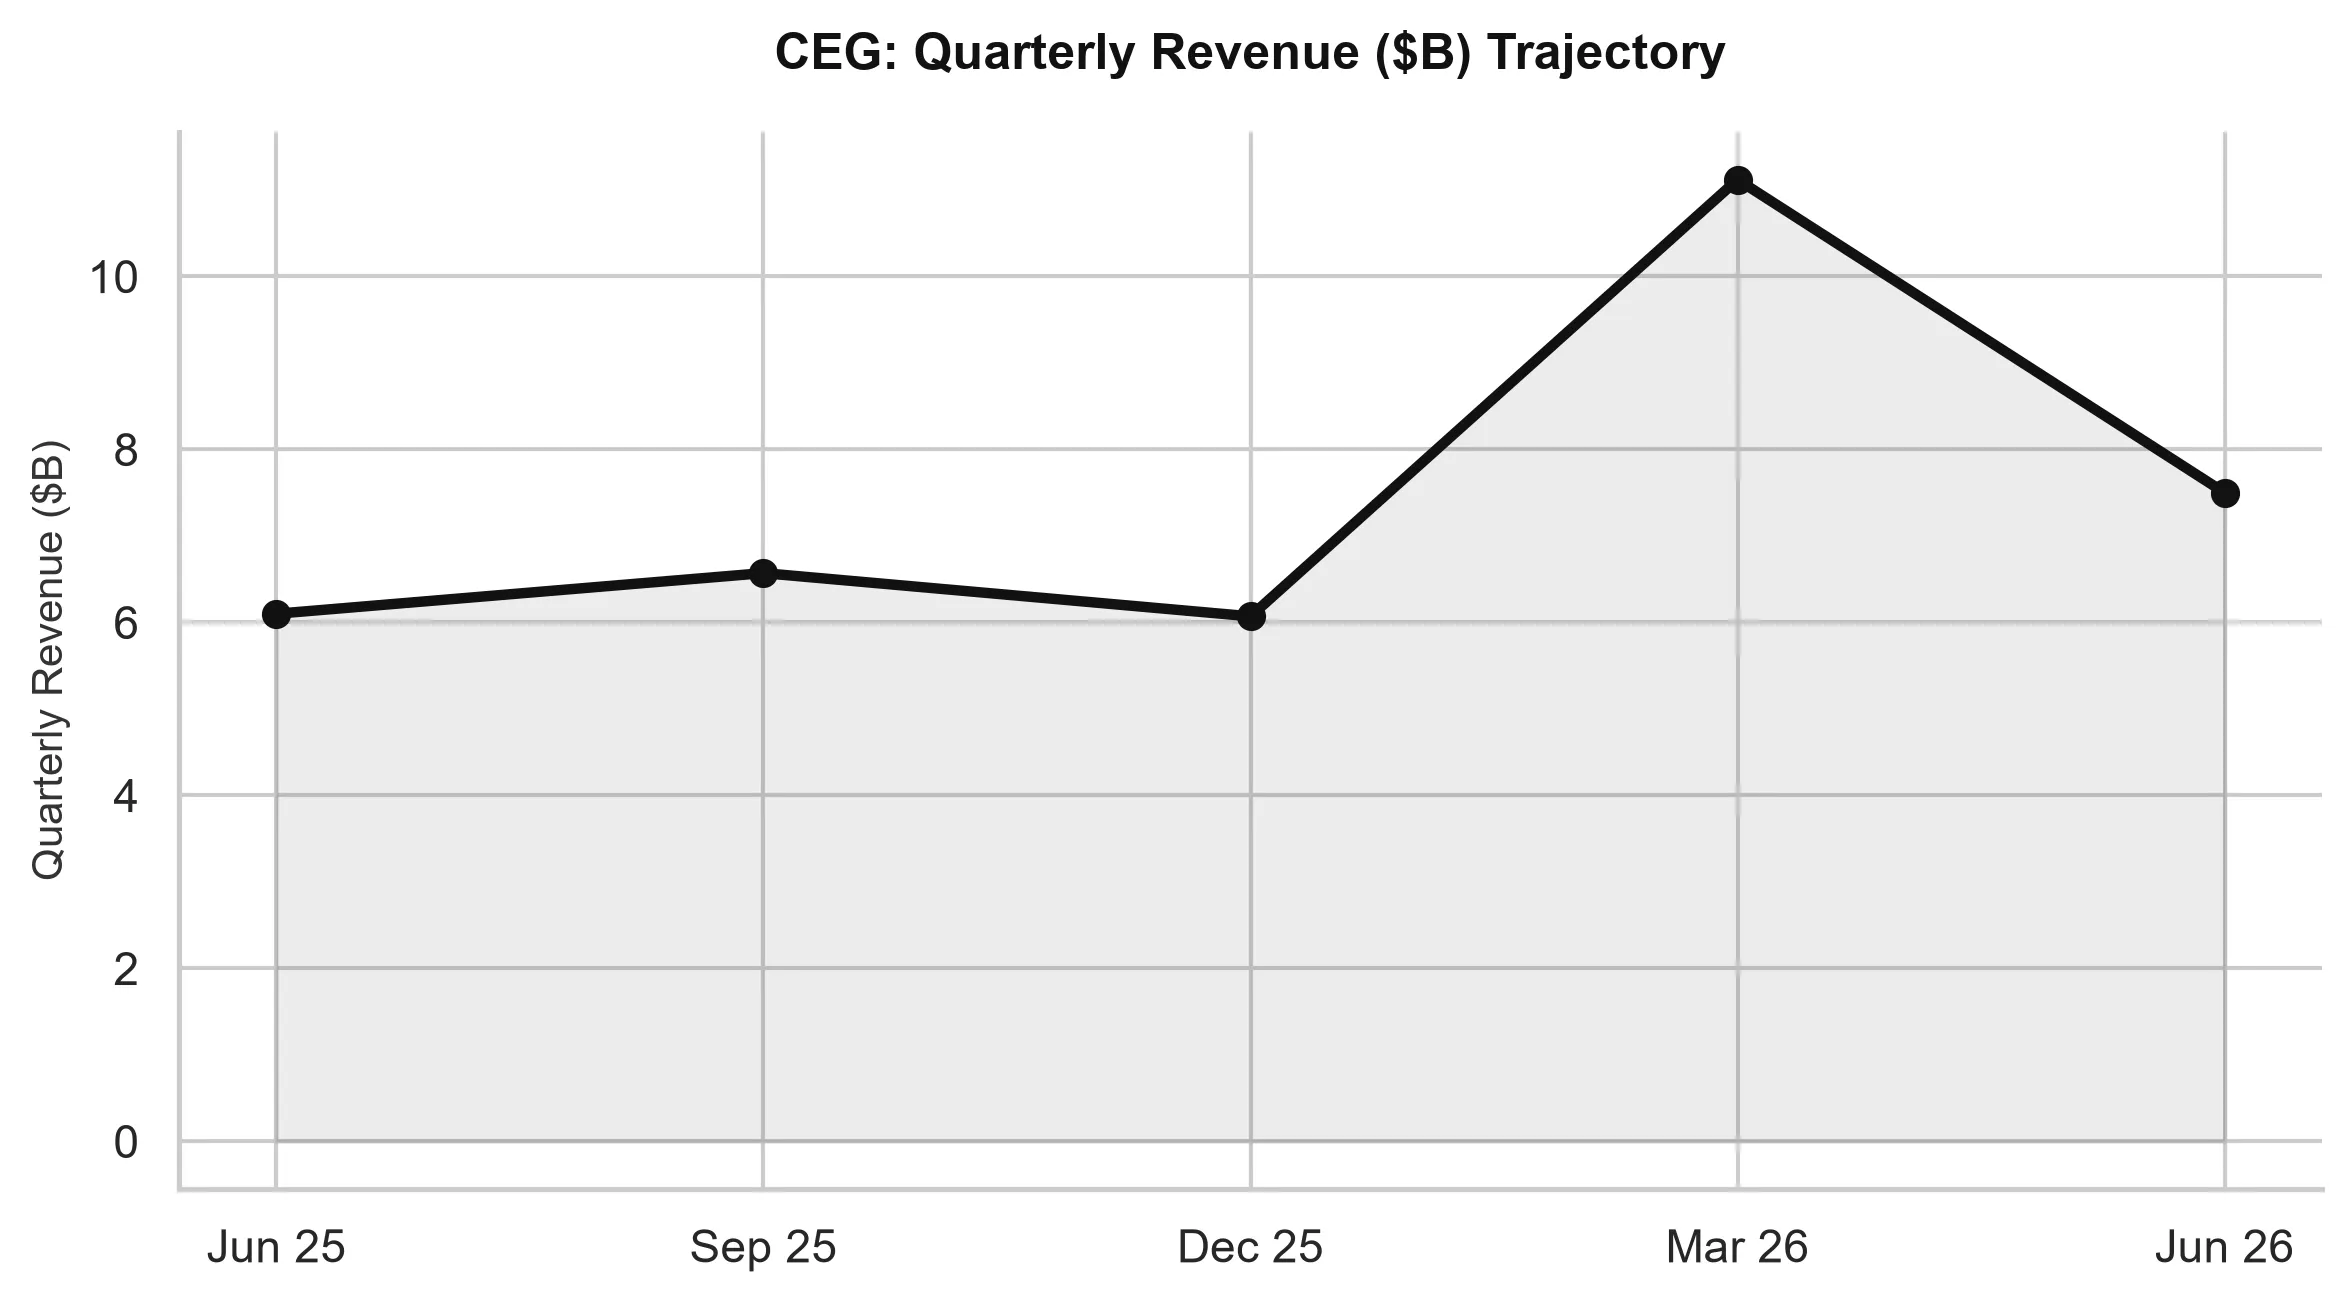
The $6.6 Billion Cash Reality
Wall Street has fallen in love with the headline revenue figures. Over the trailing twelve months, Constellation booked $31.27 billion in revenue and reported $3.46 billion in GAAP net income. On paper, operating margins sit at 8.66% and return on equity reaches 15.06%.
Yet beneath the accrual accounting lies a sobering operational metric: free cash flow over the trailing twelve months was negative $6.63 billion.
Generating power from fission is an extraordinary technological achievement, but it is also an extraordinarily expensive business. Operating 22,000 megawatts of nuclear capacity across Pennsylvania, Illinois, Maryland, and New York demands ceaseless maintenance capital expenditures, specialized refueling cycles, component replacements, and regulatory compliance outlays.
Unlike a software platform where adding an incremental customer costs fractions of a cent, adding reliable nuclear capacity involves moving literal tons of enriched uranium, overhauling multi-ton steam turbines, and retaining armies of specialized nuclear engineers.
To fund these massive capital requirements, Constellation carries $24.70 billion in total debt against just $697 million in cash and cash equivalents. That represents a cash-to-debt ratio of roughly 1 to 35. In an economic environment where institutional borrowing costs hover above 5%, servicing $24.7 billion in debt while burning $6.6 billion in free cash flow leaves virtually no margin for operational missteps.
The 2028 Execution Gap
The core thesis fueling Constellation’s 29x multiple is that tech giants will sign off-market power purchase agreements at enormous premiums to current wholesale electricity rates. Microsoft agreed to take 100% of the 835 megawatts generated by the revived Three Mile Island reactor.
What the consensus narrative routinely omits is the calendar.
Unit 1 was deactivated in 2019 because its operating costs could not compete with cheap shale gas. It has been dormant for half a decade. Bringing a decommissioned nuclear reactor back to commercial operation is not like flipping a circuit breaker in a suburban basement.
Constellation must secure formal reinstatement permits from the Nuclear Regulatory Commission (NRC), complete non-destructive inspections of the reactor pressure vessel, rebuild steam turbines, source long-lead electrical transformers currently suffering from multi-year supply chain bottlenecks, and navigate the PJM Interconnection queue.
The targeted restart date is 2028.
That means investors paying $298 per share today are paying a tech multiple on cash flows that cannot physically materialize for at least four years. In the intervening period, Constellation must deploy an estimated $1.6 billion in refurbishment capital into a single dormant facility, all while absorbing ongoing carrying costs and regulatory uncertainty.
The Regulatory Revolt at the Substation
Even if the engineering proceeds without friction, the political and regulatory backdrop is turning hostile.
Constellation and its peers are pursuing “behind-the-meter” co-location deals, where hyperscaler data centers plug directly into the generator’s substation rather than drawing power through the regional transmission grid. The tech companies like this structure because it avoids years of transmission construction queues. The power generators love it because they capture premium contracted pricing.
The people who do not love it are state utility regulators, consumer advocates, and regional grid operators.
Petitions before the Federal Energy Regulatory Commission (FERC) are already challenging these arrangements. The argument is straightforward: if hyperscalers siphon away 800 megawatts of clean baseload power from the PJM grid, the remaining grid must fire up older, dirtier, and more expensive fossil fuel peaking plants to keep residential lights on. Furthermore, the massive grid upgrades needed to handle the resulting localized transmission congestion risk being dumped onto retail utility ratepayers.
If FERC or state utility commissions mandate that co-located data centers pay full network transmission tariffs or restrict behind-the-meter interconnection, the windfall profit margins underpinning Constellation’s premium multiple could narrow dramatically.
Market Structure and the Gamma Magnet
If the fundamental cash flow is negative $6.6 billion and the primary growth catalyst is four years away, why is the stock trading near $300?
The answer lies in market plumbing and derivative flows. Over the past six weeks, institutional momentum accounts and retail options traders have piled into short-dated, out-of-the-money call options, heavily concentrated around the $310 and $330 strikes.
When retail and speculative funds buy millions of dollars in upside call options, options dealers who sell those contracts are structurally short gamma. To neutralize their risk, dealers must purchase the underlying stock as the price advances. This dynamic creates a reflexive mechanical feedback loop: call buying drives dealer hedging, dealer hedging pushes the equity higher, and higher prices attract further momentum buying.
This market structure has pinned Constellation near all-time highs. However, gamma engines work in both directions. If options volume wanes, or if a single regulatory delay from the NRC or FERC causes call skew to soften, dealer inventory unwind can transform a steady rally into a sharp, air-pocket decline.
The Verdict
Constellation Energy is an exceptionally well-run utility possessing one of the most critical infrastructure fleets on the North American continent. Nuclear power will almost certainly play an indispensable role in America’s long-term energy transition.
Paying 29x earnings, absorbing a $24.7 billion debt pile, and ignoring negative $6.6 billion in free cash flow for power delivery scheduled four years out is not an investment in clean energy. It is an investment in narrative momentum that has detached from traditional corporate finance.
Constellation Energy Corporation (CEG)
Trailing P/E
Marcus Wolfe Screen
Leverage Profile
30D Channel
Pristine cash flow conversion (1.83x) and healthy accrual ratio (-3.35%). Zero accounting anomalies detected (LOW ANOMALY RISK).
Manageable liability structure relative to institutional cash flow.
Evaluated against 5.10% US 10-Yr Benchmark (FCF Spread: -11.99% (vs 10Y Yield of 5.10%)).
Max Pain: $285.00 (+5.02%) | P/C Ratio: 2.06 | 30D Channel: $251.92 – $290.82.
$249.66 – $260.52 (-4% to -8% Pullback Accumulation)
Sustained weekly close below $244.23 (-10.0% structural stop) or fundamental cash flow deterioration.