
The modern stock market has a peculiar way of rewarding companies for being too large to fail. Walmart Inc. (WMT) currently sits at a market capitalization of $1.02 trillion, a figure that suggests it is no longer just a place to buy discounted laundry detergent but a sovereign economic state. When a retail business trades at nearly 40 times forward earnings, it has transcended the mundane world of inventory turnover and entered the rarefied air of the tech-adjacent compounders. This is the Walmart Premium: a tax that institutional investors willingly pay to hide from volatility in a world where the risk-free rate is north of 5%.
The tension here is not about whether Walmart is a good business. It is a fantastic business. It is a logistical machine that recently reported a gross margin expansion of 96 basis points, largely aided by tariff refunds and a favorable shift toward its high-margin advertising business. The problem is the math of the exit. When you buy a stock at a 0.70% free cash flow yield (the cash a company generates divided by its market value), you are effectively betting that the company will grow fast enough to justify a yield that is roughly seven times smaller than what you could get from a boring 10-Year Treasury bond.
The Efficiency Engine and the Boardroom Pivot
Walmart is currently engaged in a subtle but profound transformation from a box-mover to a data-and-automation utility. On November 16, 2026, the company appointed Joseph (Joe) E. Creed, chairman and chief executive officer of Caterpillar Inc., to its board of directors (joining the Audit and Strategic Planning and Finance committees). Management noted that his experience across finance, global operations, and the practical application of AI and automation will be valuable as they shape Walmart’s next chapter. Bringing an industrial automation chief into the boardroom underscores Walmart’s push to expand retail operating leverage through supply-chain robotics and enterprise AI.
The fundamental trajectory of the business supports this ambition, even if the valuation is running ahead of the reality. Revenue has climbed from $611 billion in FY2023 to over $713 billion in the most recent fiscal year. More importantly, the company is generating a Return on Invested Capital (ROIC) of 14.03%. In plain English, ROIC measures how much profit a company generates for every dollar of capital it puts to work. Since Walmart’s cost of capital is roughly 8.5%, it is creating significant economic value.
| Period | Revenue | Operating Income | Operating Margin | Free Cash Flow | SBC Expense |
|---|---|---|---|---|---|
| FY2023 | $611.29B | $20.43B | 3.3% | $11.98B | N/A |
| FY2024 | $648.12B | $27.01B | 4.2% | $15.12B | N/A |
| FY2025 | $680.99B | $29.35B | 4.3% | $12.66B | N/A |
| FY2026 | $713.16B | $29.82B | 4.2% | $14.92B | N/A |
The balance sheet remains a fortress, with net debt at 1.44 times EBITDA. This low leverage gives the company the flexibility to spend $29.4 billion on capital expenditures over the trailing twelve months (which compressed trailing free cash flow to $7.13 billion, or a 0.70% yield, down from $14.92 billion in FY2026) while still returning cash to shareholders. However, the quality of those returns is worth a second look. While Walmart spent $8.09 billion on share repurchases over the last twelve months, the buyback yield is a modest 0.79%. At these prices, the company is buying back its own stock at a massive premium, which is a bit like a shopper at Walmart insisting on paying double for a gallon of milk.
The Benchmark Gravity and the Peer Gap
The primary reason Walmart stays this expensive is structural. It commands a 1.9% weight in the S&P 500, meaning that every time a dollar flows into a passive index fund, nearly two cents must be spent on Walmart shares regardless of the price. This creates a mechanical bid that traditional value investors find maddening. If you are an institutional fund manager and you underweight Walmart, and the stock goes up another 5%, you lose your job. So, you buy it, you hold it, and you don’t ask too many questions about the free cash flow yield.
When we look at the peer group, the valuation disparity becomes even more striking. Target (TGT) trades at a forward P/E of 16.6x with a free cash flow yield of 4.74%. If you buy Target, you are getting nearly seven times more cash flow per dollar invested than if you buy Walmart. Of course, the market argues that Walmart is “higher quality,” but at a certain point, the price of quality becomes a burden on future returns.
| Company (Ticker) | Market Cap | Forward P/E | EV/EBITDA | Rev Growth (YoY) | Operating Margin | FCF Yield |
|---|---|---|---|---|---|---|
| Walmart (WMT) | $1.02T | 39.8x | 24.7x | 5.90% | 3.94% | 0.70% |
| Costco Wholesale (COST) | $495.6B | 44.7x | 34.0x | 11.1% | 3.8% | 1.36% |
| Target (TGT) | $72.5B | 16.6x | 10.1x | 5.3% | 5.0% | 4.74% |
| Amazon.com (AMZN) | $2.80T | 23.7x | 16.2x | 12.1% | 13.1% | -1.24% |
Costco Wholesale (COST) is the only peer that makes Walmart look cheap, trading at 44.7 times earnings. This suggests that the market has decided that “discount stores” are the new “luxury software.” Meanwhile, the Walton family continues to master long-horizon capital preservation. Their widespread use of zeroed-out Grantor Retained Annuity Trusts (often called “Walton GRATs” after Audrey Walton’s landmark 2000 U.S. Tax Court victory) allows the family to pass massive amounts of stock growth to heirs with almost zero gift tax. When the insiders are focused on generational tax shielding, it usually implies they view the current equity as a permanent store of value rather than a trading vehicle.
The Gamma Pin and the Max Pain Magnet
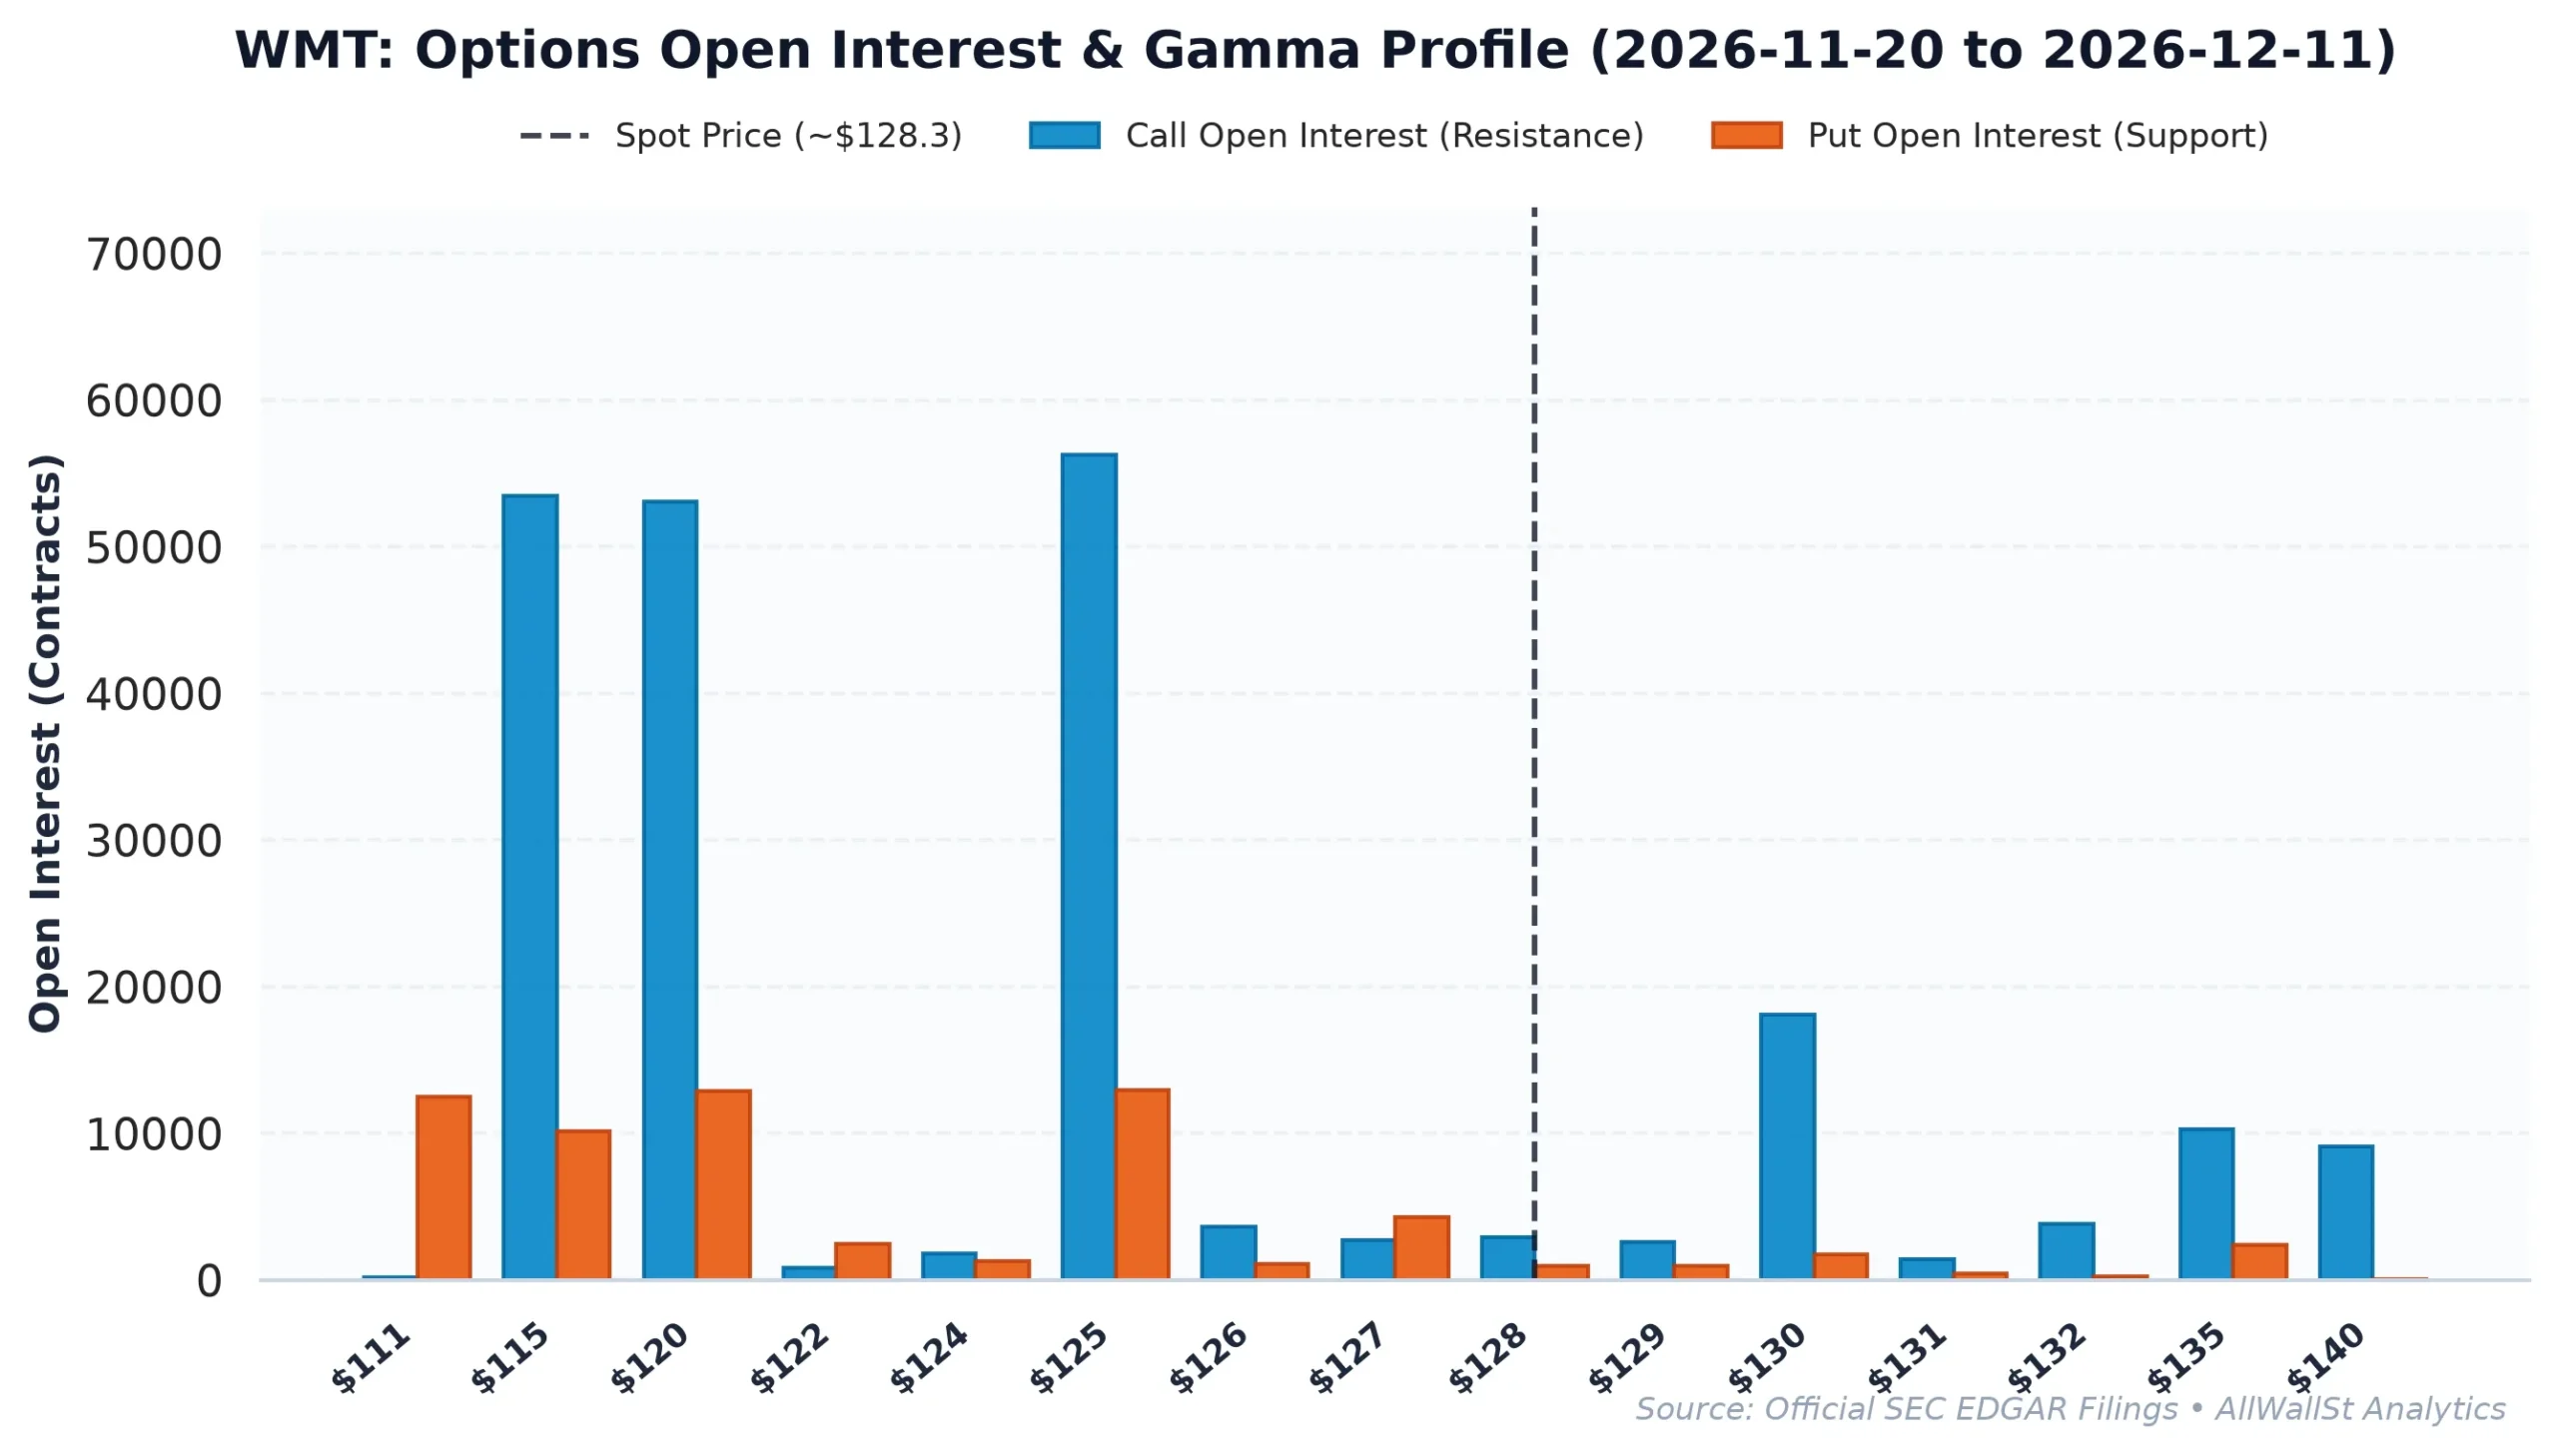
While the long-term story is about automation and index weight, the short-term story is about market structure. As we head into earnings week, the options market is showing signs of speculative heat. The Put/Call open interest ratio is a low 0.53, indicating that traders are heavily leaning into calls. In options land, this means dealers are likely long gamma. When dealers are long gamma, they tend to sell into rallies and buy into dips to stay neutral, which acts as a dampener on volatility and pins the stock price.
The most important number for the next few weeks is the Max Pain strike at $115.00. Max Pain is the price at which the highest number of options contracts expire worthless, causing the most “pain” to option buyers and the most profit for option sellers (usually the big banks and dealers). With the stock trading at $128.26, there is a significant 10.37% gap between the current price and the Max Pain magnet. If the company’s earnings report is anything less than perfect, the unwinding of these speculative call positions could force dealers to sell shares, creating a rapid trip down toward that $115 level.
Above spot, the primary overhead Call Wall sits at $130 (17,967 contracts), even as even larger in-the-money call open interest has stacked up at $115 to $125 during the recent rally. A Call Wall is an overhead strike price with concentrated open interest where option sellers are likely to defend their positions by selling the underlying stock as price approaches that threshold. This creates a ceiling on the stock. Between the $130 ceiling and the $115 Max Pain floor, Walmart is effectively boxed in. The expected 30-day move is roughly plus or minus 10%, which perfectly encompasses this range.
Buying Walmart here feels like buying a very expensive insurance policy that doesn’t actually pay out if the market crashes. You are getting a 0.77% dividend yield while the 10-Year Treasury gives you 5.14%. You are paying for the safety of the brand and the index weight, but you are doing so at a time when the options market is stretched and the valuation offers zero margin of safety. It is a brilliant company at a difficult price.
Investment Committee Steelman Dissent: The bull case rests on Walmart successfully scaling its advertising and fulfillment-as-a-service businesses, which carry significantly higher margins than groceries and could drive a massive earnings re-rating. Furthermore, if the macro environment worsens, the forced index buying and “flight to safety” could keep WMT at a permanent premium regardless of traditional cash flow metrics.
AllWallSt Investment Verdict: HOLD
Walmart Inc. (WMT)
Trailing P/E
Marcus Wolfe Screen
Leverage Profile
30D Channel
Dealer Gamma Pinning & Max Pain Alignment (WMT)
🎯 Max Pain: $115.00
Spot $128.26
Ceiling $130C Resistance ▲
Pristine cash flow conversion (1.90x) and healthy accrual ratio (-6.91%). Zero accounting anomalies detected (LOW ANOMALY RISK).
Prudent Leverage (1.44x Net Debt/EBITDA); well within investment-grade covenant headroom.
Negative yield spread (-4.45% vs 5.14% Treasury); equity requires robust multiple expansion or growth.
Max Pain: $115.00 (-10.37%) | P/C Ratio: 0.53 | 30D Channel: $114.97 – $141.55. Dealer gamma bounded between $110 Put Wall and $130 Call Wall.
WMT commands a massive ~1.9% S&P 500 benchmark footprint. Wall Street sell-side consensus reflects structural career-risk defense: institutional funds face severe benchmark tracking penalties for underweighting mega-cap heavyweights, forcing mandatory allocations regardless of current Free Cash Flow yield.
Accumulation Deferred (Await Pullback toward $107.80 – $112.20 Support Pinning)
Sustained weekly close below $110.00 (Put Wall) or acceleration in margin compression.
IC Counter-Thesis: While our neutral stance balances 46.5x trailing earnings and 0.70% FCF yield against a 5.14% 10-year yield hurdle (1.44x Net Debt/EBITDA), a decisive breakout above $130 on accelerating earnings revisions could leave sidelined capital underexposed. Conversely, a breach of $110 would confirm that valuation support is illusory.
Sources & References
- Official SEC Form 10-K Annual Report (Filed 2026-03-13)
- SEC Form 8-K Exhibit 99.1 (Press Release / Earnings) (2026-11-16)
- SEC Form 8-K Exhibit 99.1 (Press Release / Earnings) (2026-08-20)
- SEC SCHEDULE 13D/A Beneficial Ownership Disclosure (2026-08-07)
- SEC DEF 14A Proxy / M&A Filing (2026-04-23)
- Federal Register (2026-05-27): Phasedown of Hydrofluorocarbons: Allocation of 2026 Production and Consumption…
- Federal Register (2026-09-17): Granting of Requests for Early Termination of the Waiting Period Under the Premerger…
- SEC EDGAR Filings: Walmart Inc. (CIK 0000104169)
- Investor Relations: Walmart Investor Relations Portal
- Primary Filing: SEC Form 8-K (November 16, 2026)
- Primary Filing: SEC Form 10-Q (August 28, 2026)
Disclaimer: This report is for informational purposes only and does not constitute financial, legal, or tax advice. The analytical views expressed are based on market structure data and regulatory filings as of November 17, 2026. Investing in equities involves significant risk, including the potential loss of principal.