
The stock market is currently engaged in a frantic game of musical chairs, and the music just stopped for Big Tech. As the Technology sector (XLK) shed 2.51% in a single session, the institutional money is scrambling for the exits and heading straight into the sterile, fluorescent-lit hallways of the Healthcare sector (XLV), which rose 0.80% today. At the center of this rotation sits UnitedHealth Group Incorporated (UNH), a company so large and so deeply embedded in the American plumbing of wellness and billing that it effectively functions as a sovereign entity with its own tax-collection arm.
The paradox of the current market is that while everyone complains about the cost of care, almost everyone in the S&P 500 is forced to own the primary beneficiary of those costs. UnitedHealth Group Incorporated (UNH) commands a roughly 0.7% weight in the benchmark index, creating a mechanical gravity that forces institutional managers to buy the stock simply to avoid falling behind their peers. But today, the story is moving beyond mere index-tracking. With the 10-Year Treasury yield hovering at 5.14%, the search for a real equity risk premium (the extra return you get for taking stock risk over bond safety) has become a forensic exercise.
UnitedHealth Group Incorporated (UNH) is answering that call with a Free Cash Flow yield of 7.17%. In plain English, this means for every dollar you invest in the company, it generates over seven cents of pure, unadulterated cash after paying for its operations and upkeep. When you can get 2.03% more from a diversified healthcare giant than you can from a government bond, the “defensive” label starts to look like an understatement.
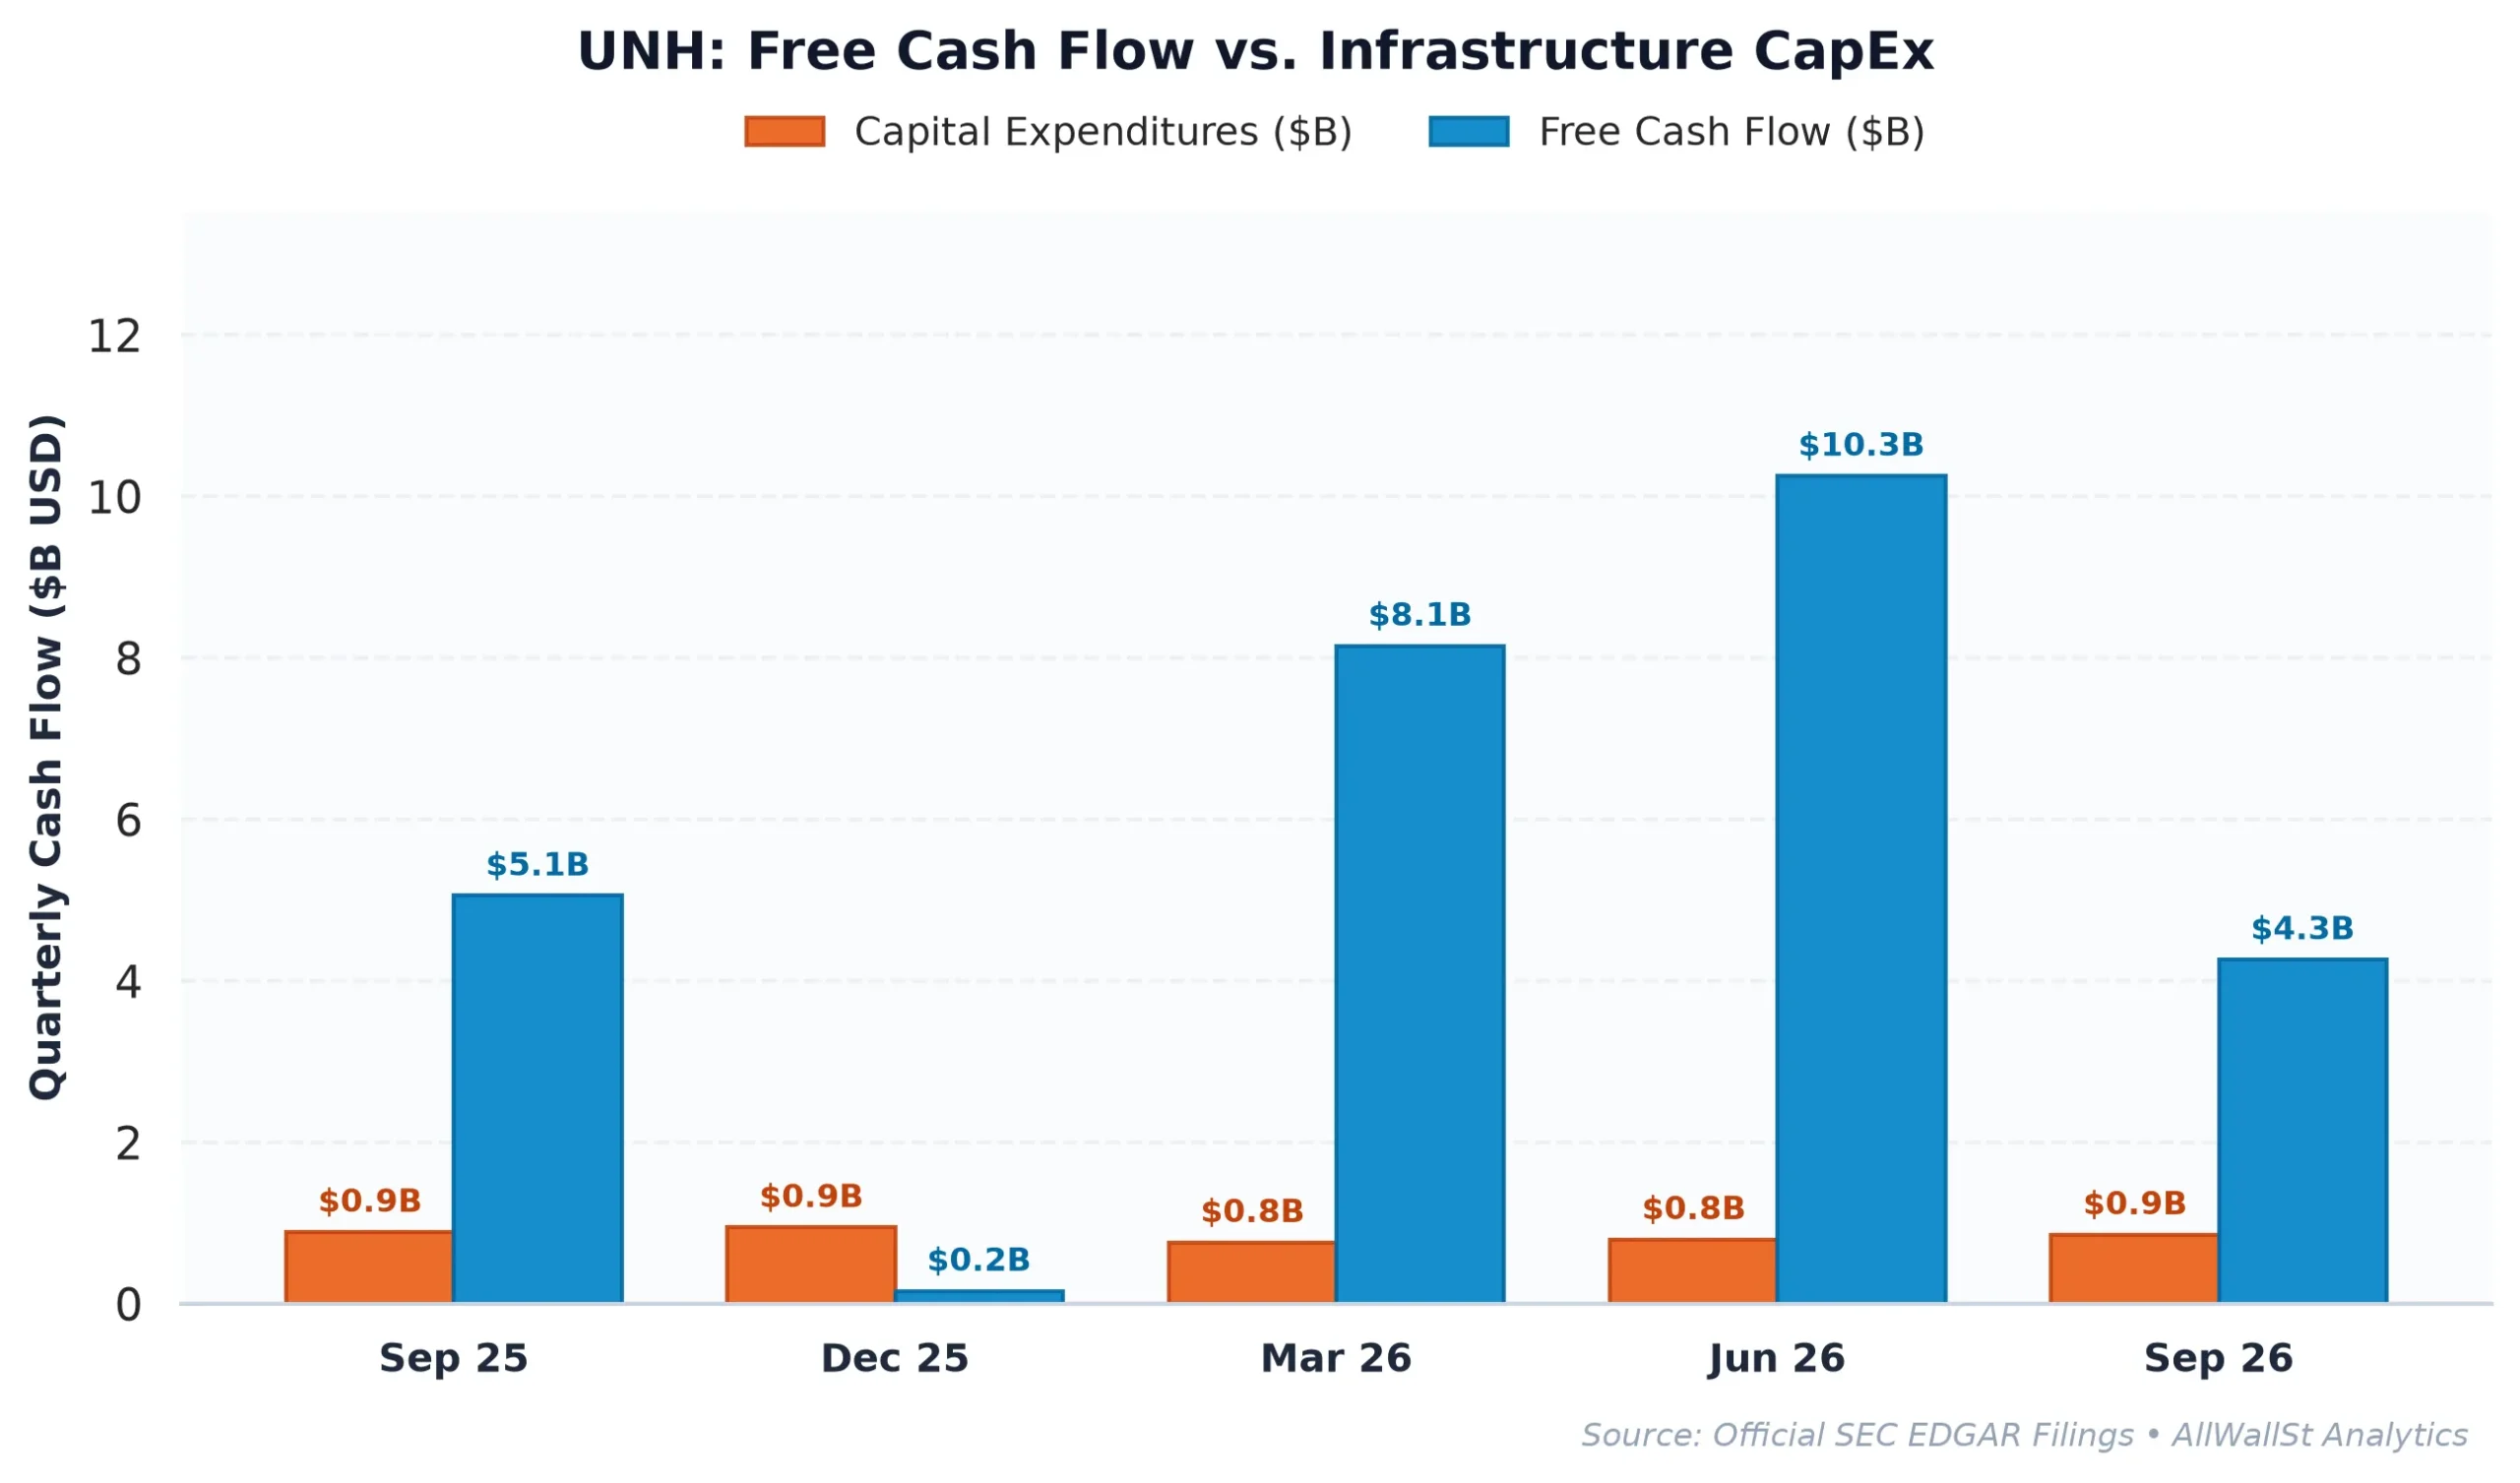
The Optum Engine and the Medical Cost Grind
To understand UnitedHealth Group Incorporated (UNH), you have to understand that it is actually two different businesses wearing a very large trench coat. On one side, you have UnitedHealthcare, the traditional insurance arm that collects premiums and pays doctors. On the other, you have Optum, which is essentially a massive data, pharmacy, and clinical services business. Optum is the secret sauce that allows the company to capture margin at every stage of the patient journey. When an Optum doctor treats a UnitedHealthcare patient and prescribes a drug through Optum Rx, the money never actually leaves the family.
In the most recent quarter, the company reported a Medical Cost Ratio (MCR) of 88.4%. For the uninitiated, the MCR is the most important number in health insurance: it represents the percentage of premium dollars actually spent on medical claims. If this number creeps toward 90%, the market panics because it suggests that people are getting “too much” healthcare, which is bad for the bottom line. However, management noted that this 88.4% figure reflects “pricing discipline” and “care delivery enhancements.” By keeping this ratio stable while growing consolidated revenues to $112.7 billion in the third quarter of 2026, the company is proving it can navigate a high-utilization environment without breaking the bank.
The capital efficiency here is staggering. UnitedHealth Group Incorporated (UNH) currently generates a Return on Invested Capital (ROIC) of 14.88%, which comfortably clears its estimated 8.5% cost of capital. This spread is the fundamental engine of shareholder wealth. It means the company is creating nearly $6.40 of value for every $100 it reinvests into its business. While the market frets over whether Optum Rx can sustain profit growth as prescription volumes fluctuate, the reality is that the broader Optum ecosystem is becoming a technology-led services provider that is far less cyclical than a pure-play insurer.
The Valuation Gap and the Quality Premium
When we look at the competitive landscape, it becomes clear why the market is willing to pay a premium for UnitedHealth Group Incorporated (UNH) compared to its peers. The company currently trades at a forward price-to-earnings (P/E) multiple of 17.7x, which looks expensive next to The Cigna Group (CI) at 9.0x or CVS Health (CVS) at 10.3x. But valuation is rarely a matter of finding the lowest number: it is about finding the highest quality of cash flow.
| Company (Ticker) | Market Cap | Forward P/E | EV/EBITDA | Rev Growth (YoY) | Operating Margin | FCF Yield |
|---|---|---|---|---|---|---|
| UnitedHealth Group (UNH) | $369.8B | 17.7x | 14.5x | -0.40% | 5.85% | 7.17% |
| Elevance Health (ELV) | $95.4B | 14.6x | 9.9x | 1.4% | 4.0% | 8.37% |
| The Cigna Group (CI) | $79.1B | 9.0x | 8.0x | 5.6% | 3.8% | 10.36% |
| CVS Health (CVS) | $115.0B | 10.3x | 10.1x | 5.4% | 3.1% | 10.28% |
Cigna and CVS might offer higher raw Free Cash Flow yields, but they lack the vertical integration and scale of the Optum platform. UnitedHealth Group Incorporated (UNH) maintains an operating margin of 5.85%, which is significantly higher than CVS Health’s 3.1%. This margin lead is the result of decades of clinical data aggregation. By knowing more about patient outcomes than anyone else, the company can price its products more accurately and avoid the “blow-up” quarters that frequently plague smaller insurers.
Furthermore, the company is a shareholder return machine. It recently announced a full-year 2026 adjusted earnings outlook of at least $20.50 per share. It is also returning capital through a total shareholder yield of 3.75%, split between a 2.25% dividend and a 1.50% buyback program. While a 1.50% buyback yield might sound modest, the company spent $5.54 billion on repurchases over the last year. Crucially, this is real return: stock-based compensation (SBC) only accounts for 3.7% of operating cash flow, meaning the buybacks are actually reducing the share count rather than just mopping up executive bonuses.
Options Plumbing and the Structural Floor
In the immediate term, the options market is signaling a period of consolidation that could provide an attractive entry point for long-term investors. The “Max Pain” strike currently sits at $400.00. In market-maker terms, Max Pain is the price level where the highest number of options contracts expire worthless, creating a magnetic pull on the stock price as dealers hedge their positions into expiration. With the stock currently trading near $412.68, there is a slight downward pull toward that $400 anchor.
However, the structural support below the current price is formidable. We see a significant “Put Wall” at $350.00, where over 8,000 contracts are parked. A Put Wall acts as a floor because as the stock price approaches that level, dealers are forced to buy shares to hedge their short put positions, effectively providing a mechanical bid for the stock. On the upside, the “Call Wall” at $450.00 suggests that a massive, unbridled rally is unlikely in the next 30 days, as dealers will sell into strength to remain neutral.
This balanced gamma profile (a fancy way of saying dealers aren’t currently forced to chase the stock in either direction) suggests that UnitedHealth Group Incorporated (UNH) will likely trade within its expected 30-day move of plus or minus 8.68%. For an institutional investor, this range-bound behavior is a feature, not a bug. It allows for disciplined accumulation in a sector that is currently acting as the primary hedge against tech-driven volatility and rising sovereign yields.
The macro environment is currently punishing “hope” and rewarding “cash.” With a 7.17% FCF yield and a dominant position in the healthcare services stack, the company is one of the few places where an investor can find a double-digit return on capital backed by a fortress balance sheet. The recent appointment of a new board member with deep clinical leadership experience only reinforces the board’s focus on the “care” side of the equation, which is where the long-term regulatory safety resides.
Investment Committee Steelman Dissent
The primary risk to this thesis is a continued rise in the Medical Cost Ratio beyond 89%, which would signal that the post-pandemic surge in outpatient procedures is not yet fully priced into premiums. Additionally, new Department of Labor rules regarding Pharmacy Benefit Manager fee transparency could compress margins within Optum Rx if the company is forced to pass more rebates directly to plan sponsors.
AllWallSt Investment Verdict: BUY
(Initiation)
UnitedHealth Group Incorporated (UNH)
Trailing P/E
Marcus Wolfe Screen
Leverage Profile
30D Channel
Dealer Gamma Pinning & Max Pain Alignment (UNH)
🎯 Max Pain: $400.00
Spot $412.67
Ceiling $450C Resistance ▲
Pristine cash flow conversion (1.63x) and healthy accrual ratio (-2.47%). Zero accounting anomalies detected (LOW ANOMALY RISK).
Prudent Leverage (1.58x Net Debt/EBITDA); well within investment-grade covenant headroom.
Favorable equity risk premium (+2.03% FCF yield spread over 5.14% US 10-Yr Treasury benchmark).
Max Pain: $400.00 (-3.07%) | P/C Ratio: 0.94 | 30D Channel: $376.85 – $448.49. Dealer gamma bounded between $350 Put Wall and $450 Call Wall.
UNH represents a core ~0.7% index pillar. Institutional managers face persistent benchmark drag if under-allocated during sector rallies, biasing sell-side consensus toward institutional overweight.
$343.00 – $357.00 (Options Support Pinning)
Sustained weekly close below $350.00 (Put Wall) or gross margin compression below 20.05%.
Bearish IC Dissent: At 23.6x trailing earnings and 7.17% FCF yield against a 5.14% 10-year risk-free hurdle, UnitedHealth Group Incorporated (UNH) leaves limited cushion for top-line deceleration or margin compression (1.58x Net Debt/EBITDA). If institutional flows break below the $350 put wall, dealer de-hedging can accelerate multiple contraction before fundamental buyers step in.
Sources & References
- Official SEC Form 10-K Annual Report (Filed 2026-03-02)
- SEC Form 8-K Exhibit 99.1 (Press Release / Earnings) (2026-11-09)
- SEC DEF 14A Proxy / M&A Filing (2026-04-21)
- Federal Register (2026-06-10): Ascension Health Alliance; Analysis of Proposed Agreement Containing Consent Orders To…
- Federal Register (2026-11-02): Improving Transparency Into Pharmacy Benefit Manager Fee Disclosure
- ClinicalTrials.gov NCT04321369 (COMPLETED)
- UnitedHealth Group SEC EDGAR Filings: https://www.sec.gov/edgar/browse/?CIK=0000731766
- Investor Relations Portal: https://www.unitedhealthgroup.com
- SEC Form 10-Q (Filed Nov 3, 2026): https://www.sec.gov/Archives/edgar/data/731766/000073176626000266/unh-20260930.htm
- SEC Form 8-K (Earnings Release Oct 13, 2026): https://www.sec.gov/Archives/edgar/data/731766/000073176626000255/earningsrelease3q26unh.htm
Disclaimer: This report is for informational purposes only and does not constitute financial, legal, or investment advice. UnitedHealth Group (UNH) is a publicly traded entity. All investments carry risk, and past performance is not indicative of future results. The author has no position in the securities mentioned at the time of publication.