
The business of moving money is often less about the technology of the movement and more about the legal architecture of the friction. Visa Inc. (V) is the undisputed master of this architecture, operating a global network that effectively taxes every swipe, tap, and digital click. We previously viewed this toll booth with a degree of caution, assigning a HOLD rating last month as the market digested regulatory static. However, the recent delay in the $38 billion swipe fee ruling and a fresh batch of fiscal 2026 data suggest that Visa is not just surviving the regulatory gauntlet, it is outrunning it.
The company recently disclosed in its SEC filings that it deposited another $405 million into its litigation escrow account this past September. This follows a $250 million deposit in June, part of a retrospective responsibility plan designed to insulate shareholders from the financial fallout of long-running class-action lawsuits. To a normal business, half a billion dollars in legal deposits is a catastrophe. To Visa, which generated $23.5 billion in GAAP net income for the full fiscal year 2026, it is a rounding error. The market is beginning to realize that the “worst-case” regulatory scenarios are likely to be managed through these pre-funded buckets rather than a structural collapse of the business model.
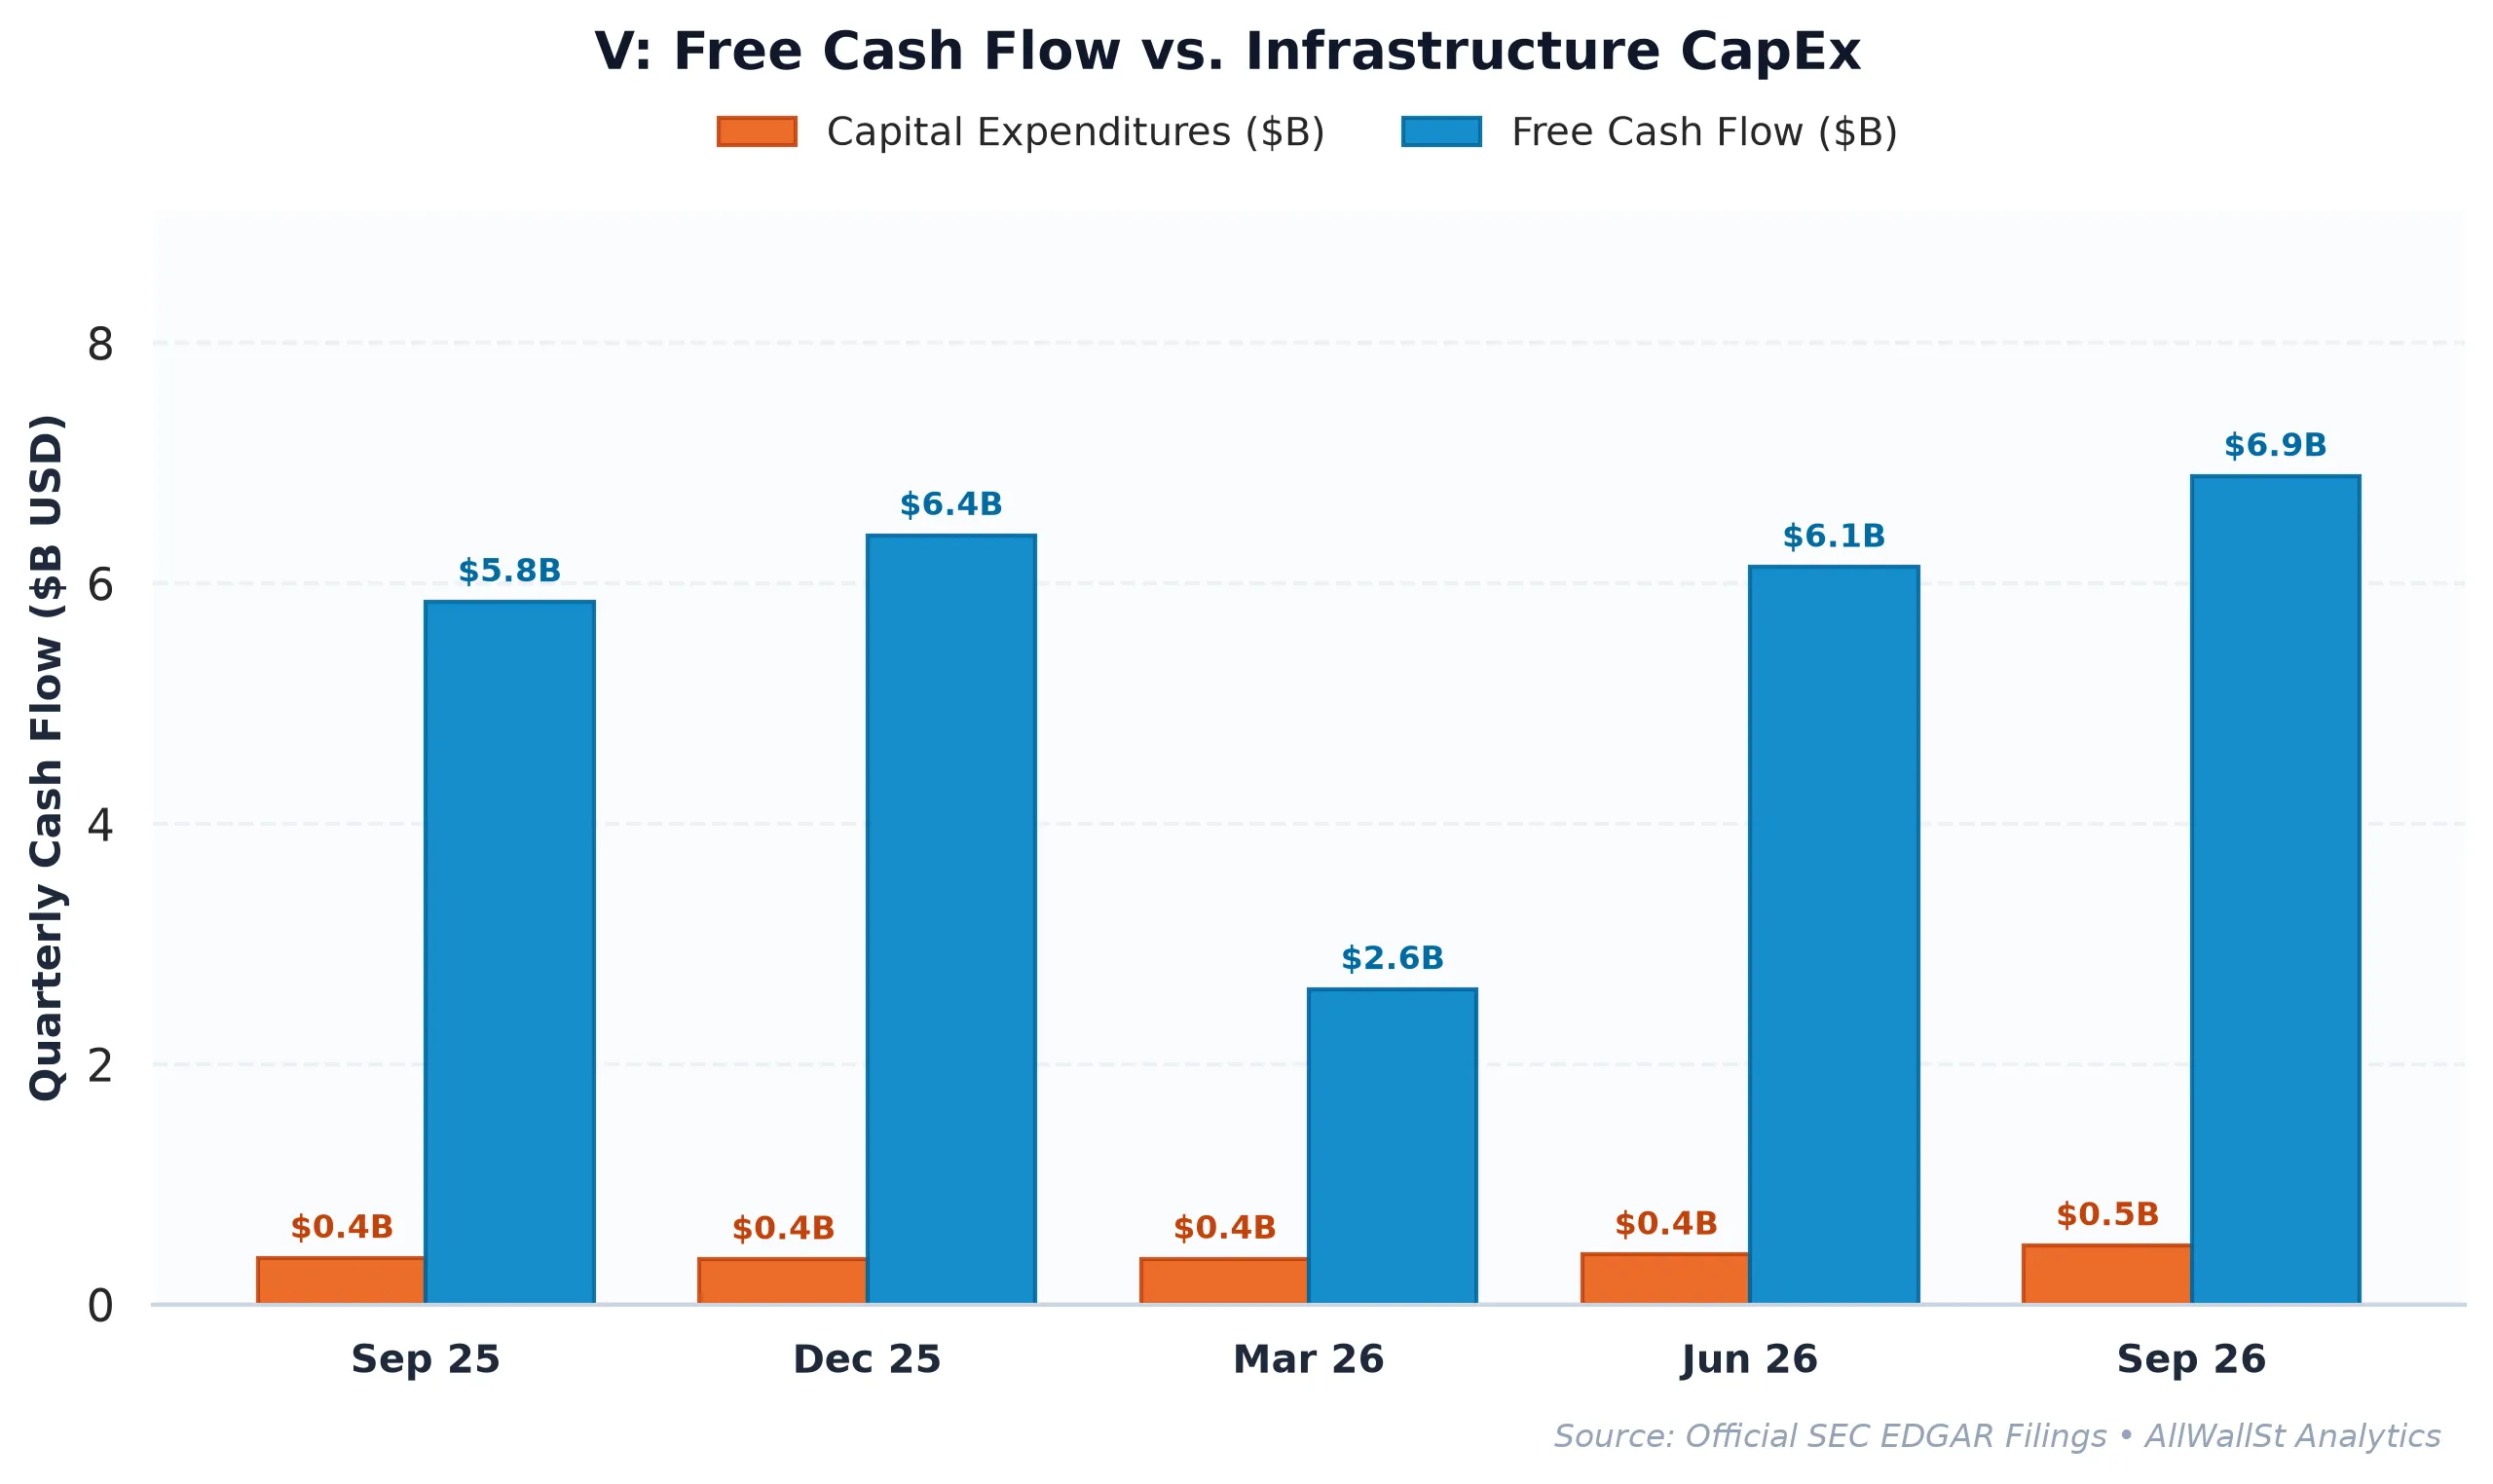
The Economics of the Inevitable
Visa is currently operating with a gross margin of 97.6%, a figure that feels more like a typo than a financial metric. In plain English, it costs Visa almost nothing to process the next dollar of volume. This translates into an operating margin of 66.3%, meaning that for every dollar of revenue, nearly sixty-six cents falls straight to the bottom line before the tax man arrives. This efficiency is the primary reason why the company can support a Return on Invested Capital (ROIC) of 53.4%, which is more than six times its estimated cost of capital.
The recent fiscal 2026 results show net revenue grew 15% to $45.9 billion, driven by a persistent recovery in cross-border travel and a steady migration toward digital payments. While the bears point to the rise of “pay-by-bank” and alternative rails, Visa is quietly co-opting the threat. The company recently expanded its industry partnerships to target secure AI agent payments, essentially building the toll booth for the next generation of non-human consumers. This ability to pivot into new payment flows while maintaining a fortress-like balance sheet (Net Debt/EBITDA is a negligible 0.28x) makes the current valuation look increasingly attractive.
The Peer Gap and the Price of Quality
When we look across the credit services landscape, Visa occupies a unique middle ground between the high-growth premium of Mastercard and the value-trap territory of legacy fintech. Visa trades at a forward P/E of 23.5x, which is a noticeable discount to Mastercard (MA) at 27.0x. While Mastercard often commands a higher multiple due to its slightly higher international exposure, the gap has widened to a point where Visa offers a superior margin of safety for institutional allocators.
| Company (Ticker) | Market Cap | Forward P/E | EV/EBITDA | Rev Growth (YoY) | Operating Margin | FCF Yield |
|---|---|---|---|---|---|---|
| Visa (V) | $750.5B | 23.5x | 23.4x | 13.20% | 66.31% | 2.80% |
| Mastercard (MA) | $545.8B | 27.0x | 24.3x | 14.0% | 60.1% | 3.05% |
| American Express Compa (AXP) | $208.6B | 15.4x | N/A | 11.3% | 19.4% | N/A |
| PayPal Holdings (PYPL) | $46.8B | 9.5x | 7.8x | 2.0% | 17.7% | 9.58% |
The contrast with PayPal (PYPL) is even more striking. While PayPal looks “cheap” at 9.5x forward earnings, its operating margin of 17.7% is a fraction of Visa’s. Visa is not just a payment processor; it is the network that the processors use. This structural dominance allows Visa to return massive amounts of capital to shareholders, including $25.6 billion in dividends and buybacks during the last fiscal year. For a company of this scale to grow revenue at double digits while shrinking its share count is the textbook definition of a compounding machine.
The Put Wall and the Tactical Setup
From a market structure perspective, Visa is currently pinned by a defensive options skew. The Put/Call open interest ratio sits at 1.33, indicating that institutional traders have bought significant downside protection. This has created a “Put Wall” at the $400 strike, which acts as a mechanical floor where options dealers are forced to buy the underlying stock to hedge their positions as the price approaches that level. Conversely, the “Max Pain” strike, the point where the greatest number of options contracts expire worthless, is currently $405.
This suggests that the stock is coiled for a mean-reversion move higher toward that $405 magnet as we move through the November expiration cycle. With the 30-day expected move priced at +/-7.2%, the market is bracing for volatility that the underlying business fundamentals simply do not justify. Morgan Stanley recently raised its price target, noting that the regulatory overhang is largely priced in, while the AI payment opportunity remains underappreciated.
We are upgrading our outlook because the risk-reward has shifted. The litigation reserves are funded, the margins are expanding, and the valuation is reasonable relative to the risk-free 5.05% Treasury yield. Visa is the rare asset that provides both an inflation hedge and a play on digital transformation, all while maintaining the best margins in the S&P 500.
Investment Committee Steelman Dissent: The primary risk to this thesis is a coordinated global regulatory crackdown that successfully caps interchange fees across all major jurisdictions, permanently impairing Visa’s take-rate. Additionally, if the US 10-Year Treasury yield surges toward 6.0%, Visa’s 2.8% Free Cash Flow yield could face severe multiple compression as investors rotate into risk-free duration.
AllWallSt Investment Verdict: BUY (Upgrade from HOLD)
Visa Inc. (V)
Investigative Reporting & Public Record Sourcing: Dispatches published under Word on Wall St constitute financial news reporting, investigative journalism, and market commentary on matters of public and economic interest. Information is synthesized from publicly available regulatory filings (including SEC Form 8-K, Form 10-K, and Form 10-Q disclosures), official corporate press communications, verified news reports, and discussions with institutional market participants.
Presumption of Innocence & Unadjudicated Allegations: Any references to executive conduct, personal relationships, workplace misconduct, whistleblower claims, espionage inquiries, internal governance reviews, or government investigations represent reported allegations and active inquiries as of the publication date. They do not constitute formal judicial determinations, legal verdicts, or findings of guilt, civil liability, or statutory wrongdoing unless expressly identified as adjudicated final court judgments.
Protected Editorial Commentary & Non-Investment Counsel: All quantitative scenario analyses, key-person risk haircuts, forward valuation estimates, dealer gamma pinning levels, and investment conviction ratings reflect protected analytical opinion, editorial commentary, and financial modeling under the First Amendment. Nothing herein constitutes legal counsel, personal tax advice, or individualized investment advice. AllWallSt and its contributors assume no liability for trading, investment, or commercial decisions taken on the basis of this report.
Sources & References
- Official SEC Form 10-Q Quarterly Report (Filed 2026-07-29)
- SEC EDGAR: VISA INC. Complete Filing History
- SEC Form 8-K Exhibit 99.1 (Press Release / Earnings) (2026-10-27)
- SEC Form 8-K Exhibit 99.1 (Press Release / Earnings) (2026-07-28)
- SEC 425 Proxy / M&A Filing (2026-05-11)
- Federal Docket: The Pizza Standard LLC v. Visa Inc. (2026-09-30)
- Visa Inc. SEC Form 10-K (Filed 2026-11-05): https://www.sec.gov/Archives/edgar/data/1403161/000140316126000134/v-20260930.htm
- Visa Inc. SEC Form 8-K (Filed 2026-10-27): https://www.sec.gov/Archives/edgar/data/1403161/000140316126000126/v-20261027.htm
- Visa Investor Relations: https://corporate.visa.com
- Federal Court Docket (EDNY): The Pizza Standard LLC v. Visa Inc. (1:26-cv-06087)
Regulatory Disclaimer: This report is for informational purposes only and does not constitute investment advice. AllWallSt and its analysts are not registered investment advisors. Financial markets involve significant risk, and past performance is not indicative of future results. Always consult with a certified financial professional before making investment decisions. All data is sourced from primary SEC filings and market feeds; however, accuracy cannot be guaranteed. AllWallSt may hold positions in the securities mentioned.