
If you were setting out to invent the perfect business from scratch, you would probably invent Visa Inc. (V). You would build a global financial network that sits quietly between millions of merchants and billions of consumers, taking a microscopic bite out of almost every digital transaction on earth. You would not invent the actual bank that takes the credit risk, nor would you print the physical plastic cards. You would simply build the electronic piping, charge a toll for every byte of transaction data flowing through it, and collect gross margins of 97.7%.
It is a fantastic trade. In fact, Wall Street is so enamored with this setup that the consensus preview for Visa’s upcoming earnings release has coalesced around a single, highly optimistic talking point: “Value-Added Services.” The narrative currently broadcasting across financial media suggests that even if consumer spending slows down, Visa can simply sell more fraud prevention, identity verification, and cross-border analytics to banks, driving net income forever upward.
While financial television host panels debate whether Chief Executive Officer Ryan McInerney will beat quarterly consensus estimates by a few pennies, institutional ETF issuers quietly spent Friday as net sellers of Visa stock.
The discrepancy here is not about whether Visa is a good business. It is about simple arithmetic and the cost of capital.
The Negative Equity Risk Premium Problem
Here is how the numbers actually stack up when you remove the earnings season cheerleading.
At its current trading price around $401.02, Visa commands a market capitalization of $752.9 billion. Over the trailing twelve months, the business generated $20.4 billion in Free Cash Flow on $44.5 billion of total revenue. That represents a staggering 50.8% net profit margin and an operating margin of 66.1%. Capital expenditure requirements are practically negligible, coming in at just 4.89% of revenue ($2.18 billion).
The problem is what you have to pay to own those cash flows. Visa trades at a trailing price-to-earnings ratio of 34.1x and a forward multiple of 26.7x. Divide that $20.4 billion in free cash flow by its $752.9 billion market cap, and you arrive at a Free Cash Flow yield of exactly 2.71%.
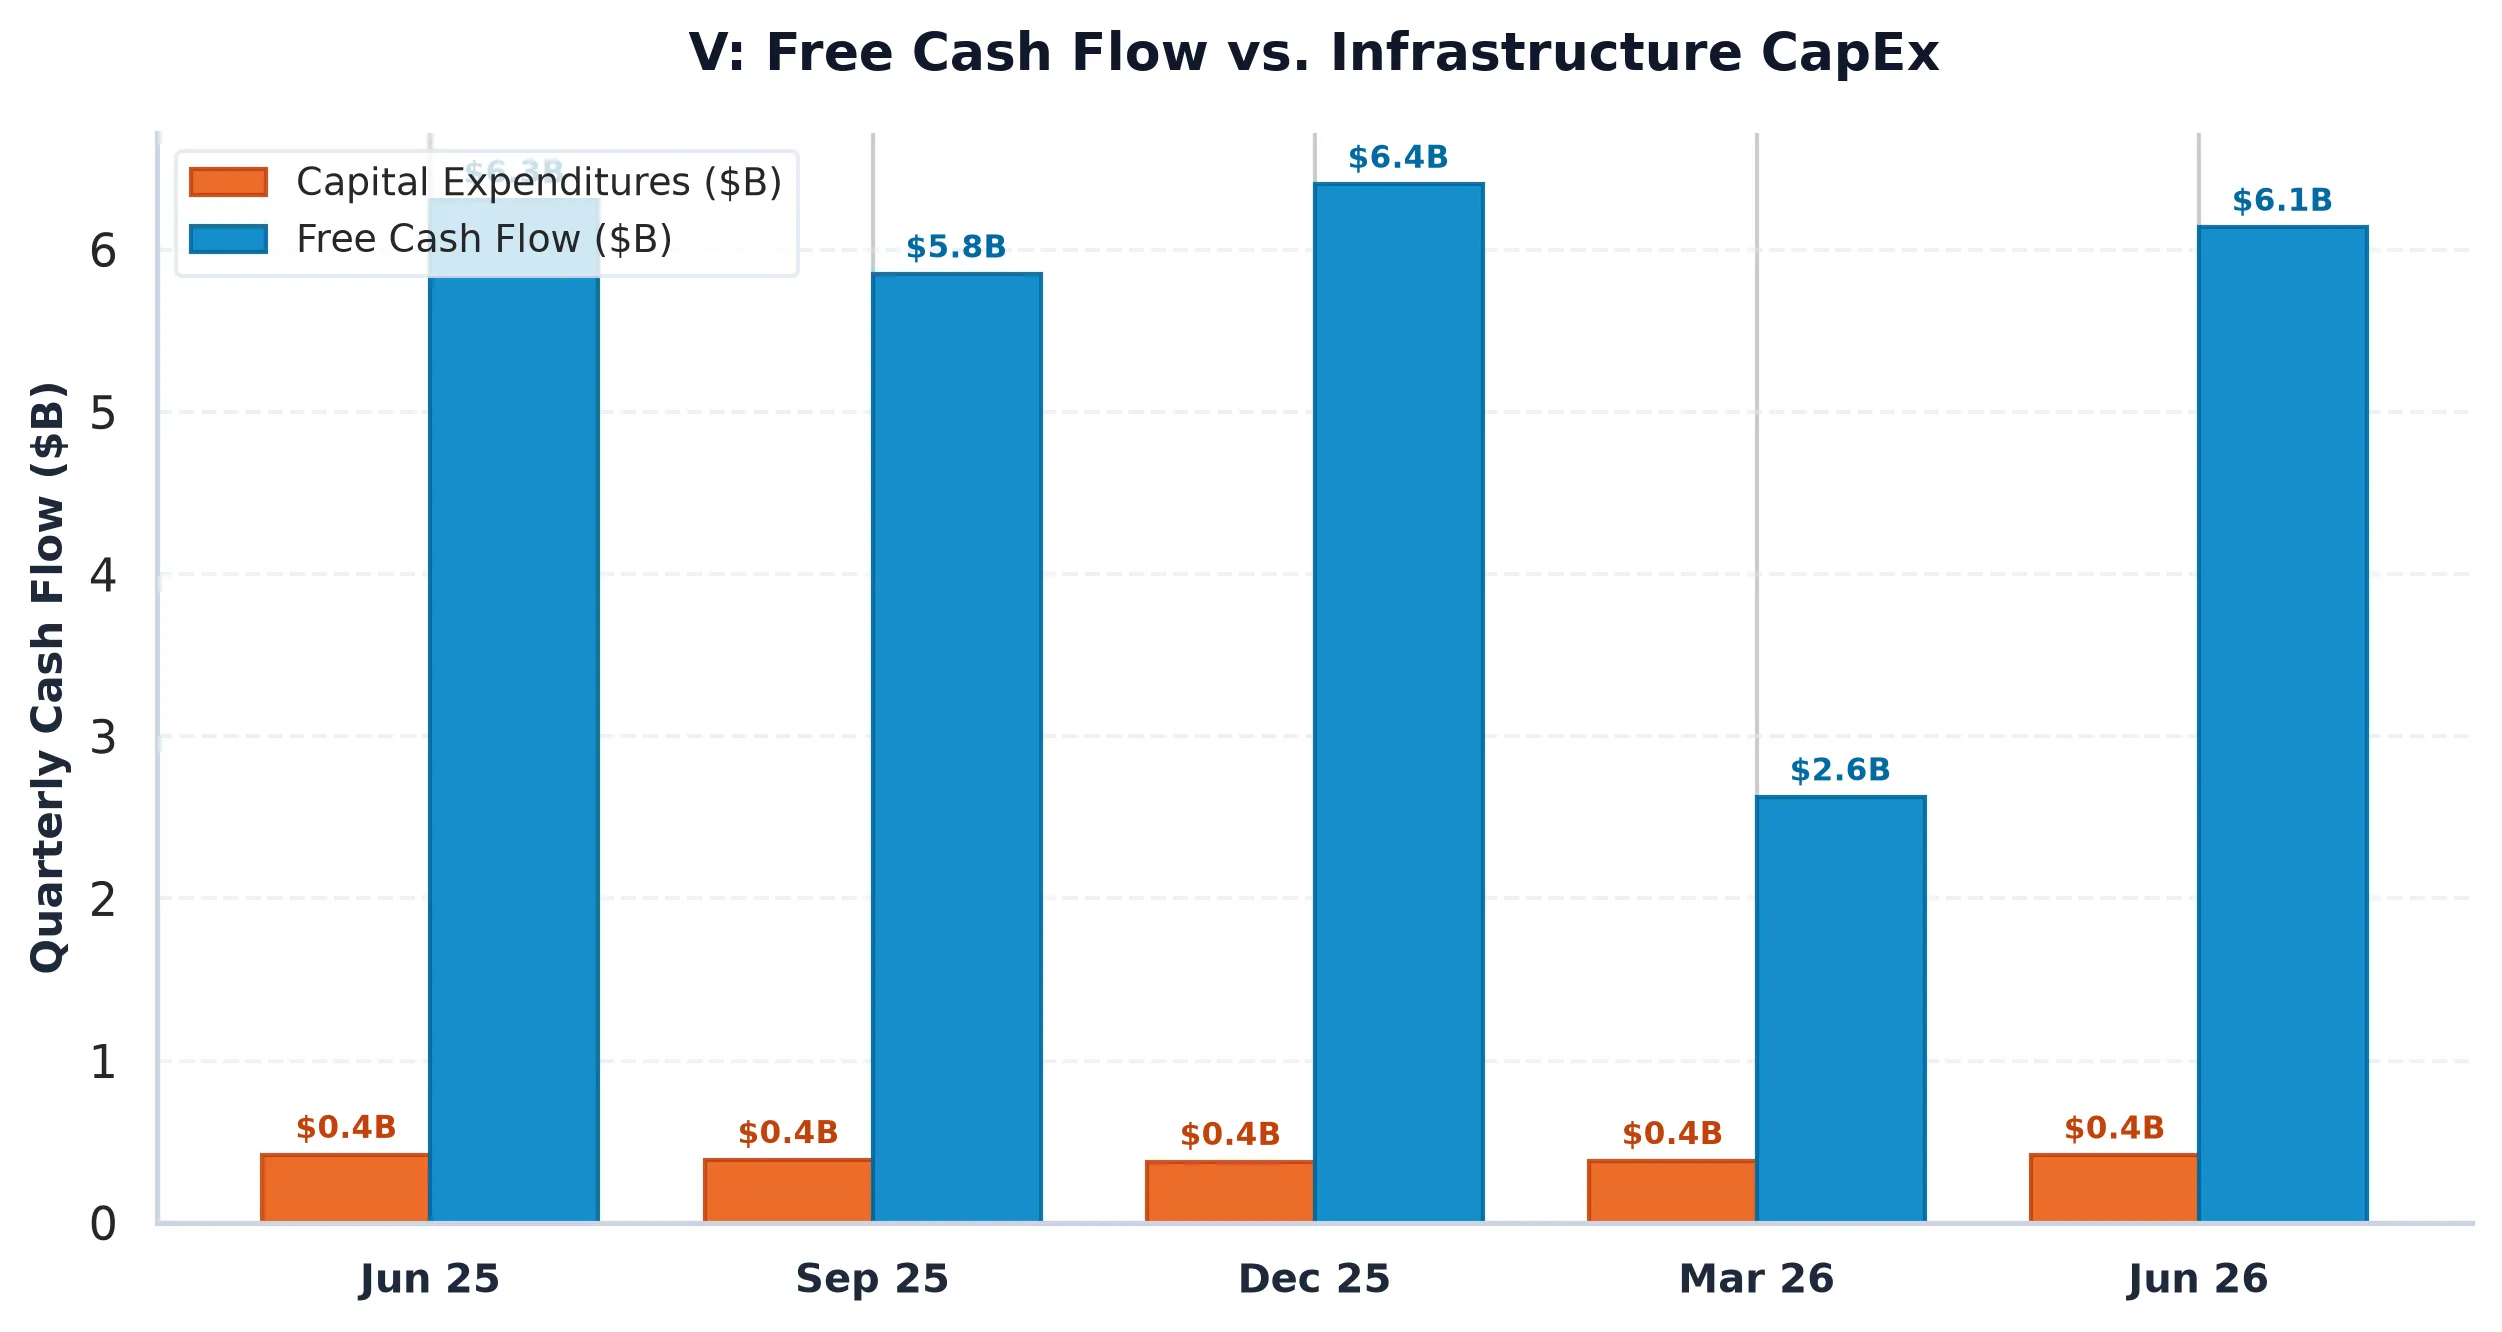
Meanwhile, the benchmark US 10-Year Treasury yield sits at 4.99%.
That means equity investors buying Visa at current levels are accepting a negative Equity Risk Premium spread of -2.28%. You are effectively paying the payment giant a 228 basis point annual penalty for the privilege of holding equity risk instead of holding risk-free government debt.
In a world where benchmark interest rates were anchored at zero, paying 34 times earnings for a high-margin toll road made total sense. Cash in a bank yielded nothing, so paying up for cash flows ten years out was a rational response to central bank policy. But in a 5% yield world, a 2.71% free cash flow yield demands that Visa grow its earnings at double-digit rates indefinitely just to break even against a risk-free bond.
To justify that valuation gap, consensus claims that value-added services will insulate the bottom line from any macro volatility. But selling software bolt-ons to retail banks is a very different business from taking an automated cut of global consumer spending. One is an inescapable toll; the other is a corporate IT sales pitch.
Options Structure and the Implied Volatility Trap
While consensus commentators focus on quarterly guidance, the derivatives market shows a far more disciplined tug-of-war playing out behind the scenes.
Implied volatility on short-dated options has expanded to an annualized 42.62%, pricing in a 30-day expected move of +/- $49.00 (or roughly 12.2%). Retail traders buy options into earnings expecting dramatic breakouts, but dealer inventory tells a more restrained story:
- Put/Call Open Interest Ratio: 0.87 (Balanced inventory between upside call specs and downside hedges)
- Max Pain Strike: $392.50 (-2.12% below current spot)
- Primary Call Resistance (Call Wall): $405.00
- Primary Put Support (Put Wall): $390.00
Options dealers are long gamma near current spot prices, bound tightly between the $405 Call Wall above and the $390 Put Wall below. Unless earnings deliver a shock far beyond what fundamental models suggest, dealer delta-hedging will naturally absorb buying pressure near $405 and buy dips near $390, pinning the stock close to the $392.50 Max Pain strike through option expiration.
Elevated options volatility creates a classic environment where options sellers harvest rich implied volatility while underlying equity prices remain bound within dealer-hedged channels.
       +-------------------------------------------------------+
       |             VISA OPTIONS MARKET STRUCTURE             |
       +-------------------------------------------------------+
       |                                                       |
       |  Call Wall (Resistance):  $405.00 (2,661 Contracts)   |
       |  Current Spot Price:       $401.02                     |
       |  Max Pain Magnet:          $392.50 (-2.12%)            |
       |  Put Wall (Support):       $390.00 (1,564 Contracts)   |
       |                                                       |
       +-------------------------------------------------------+
Balance Sheet Quality Meets Macro Reality
None of this is to say that Visa is in financial danger. According to its latest Form 10-Q filing with the SEC, the company maintains $13.79 billion in cash and cash equivalents against total debt of $23.86 billion, leaving net leverage at a modest 0.32x EBITDA. Its reported Return on Equity of 61.19% remains a testament to financial engineering and persistent share buybacks.
However, balance sheet durability does not immunize a stock against multiple compression. If nominal consumer spending slows, or if merchant fee regulations compress domestic take-rates, value-added service growth will not magically offset the duration risk embedded in a 2.71% cash yield.
When institutional money managers look across the asset landscape and see risk-free debt returning 5%, paying 34 times earnings for consumer payment exposure requires perfection. If perfection is not delivered in the forward guidance, the toll booth will remain a great business, but a mediocre investment.
Visa Inc. (V)
Trailing P/E
Marcus Wolfe Screen
Leverage Profile
30D Channel
Pristine cash flow conversion (1.15x) and healthy accrual ratio (-3.01%). Zero accounting anomalies detected (LOW ANOMALY RISK).
Prudent Leverage (0.31x Net Debt/EBITDA); well within investment-grade covenant headroom.
Negative yield spread (-2.18% vs 5.10% Treasury); equity requires robust multiple expansion or growth.
Max Pain: $395.00 (-3.79%) | P/C Ratio: 0.93 | 30D Channel: $380.49 – $440.59. Dealer gamma bounded between $390 Put Wall and $405 Call Wall.
V represents a core ~1.4% index pillar. Institutional managers face persistent benchmark drag if under-allocated during sector rallies, biasing sell-side consensus toward institutional overweight.
$382.20 – $397.80 (Options Support Pinning)
Sustained weekly close below $390.00 (Put Wall) or gross margin compression below 97.68%.
Sources & References
- Official SEC Form 10-K Annual Report (Filed 2025-11-06)
-
SEC EDGAR Database: Visa Inc. Regulatory Filings (CIK 0001403161)
- Official Corporate Relations: Visa Investor Relations Portal
- Primary Exchange Data: NYSE Consolidated Tape & Options Clearing Corporation Disclosures.
Financial Journalism Disclaimer: This analysis is published strictly for informational, educational, and narrative purposes and does not constitute individual investment advice, financial promotion, or a solicitation to purchase or sell securities. Capital markets involve substantial risk of loss. Always consult a qualified fiduciary or legal professional before executing capital allocation strategies.