
The prevailing narrative on Wall Street this morning is that Walmart Inc. (WMT) has ceased being a mere purveyor of discounted peanut butter and paper towels, having successfully metamorphosed into a high-margin technology titan. Financial television anchors speak breathlessly about high-margin advertising networks, automated fulfillment grids, and generative search algorithms. The market has rewarded this transformation by bidding the company to a market capitalization of $998.3 billion, pricing the shares at 38.9x forward earnings and treating the enterprise as though it were a pure-play cloud computing platform that simply happens to park eighteen-wheelers behind its server farms.
There is, of course, a minor snag in this software narrative: moving physical goods across a continent still requires combustion engines, asphalt, and human labor. While the market celebrates Walmart Connect advertising margins, the company’s trucks still burn petroleum. Surging diesel prices have quietly carved a $2.0 billion bite out of corporate operating expenses, reminding investors that moving boxes of cereal across physical space remains an unyielding, capital-heavy affair.
When a retailer trades at an enterprise multiple normally reserved for recurring subscription software, even modest frictions in physical reality begin to matter. In a macroeconomic regime where the 10-Year US Treasury yield trades near 5.09%, paying nearly forty times earnings for a business growing revenue at roughly 6% represents an extraordinary leap of faith.
The Diesel Tax on High-Multiple Software Dreams
To understand the core tension inside Walmart today, one must separate the corporate investor presentation from the income statement. In its third-quarter fiscal 2027 presentation, filed this morning via Form 8-K, management raised full-year constant-currency net sales growth guidance to a range between 4.9% and 5.2%. Adjusted operating income is now projected to climb between 8.0% and 8.6%, while the consolidated gross profit rate expanded 28 basis points year over year to 24.5%.
These are commendable operating results for an enterprise generating more than $735.8 billion in trailing twelve-month revenue. The economic machinery remains exceptionally disciplined, posting a return on invested capital (ROIC) of 14.03%, which comfortably clears its estimated 8.5% cost of capital. That spread proves the core retail franchise continues to generate genuine economic profit rather than merely consuming balance-sheet assets.
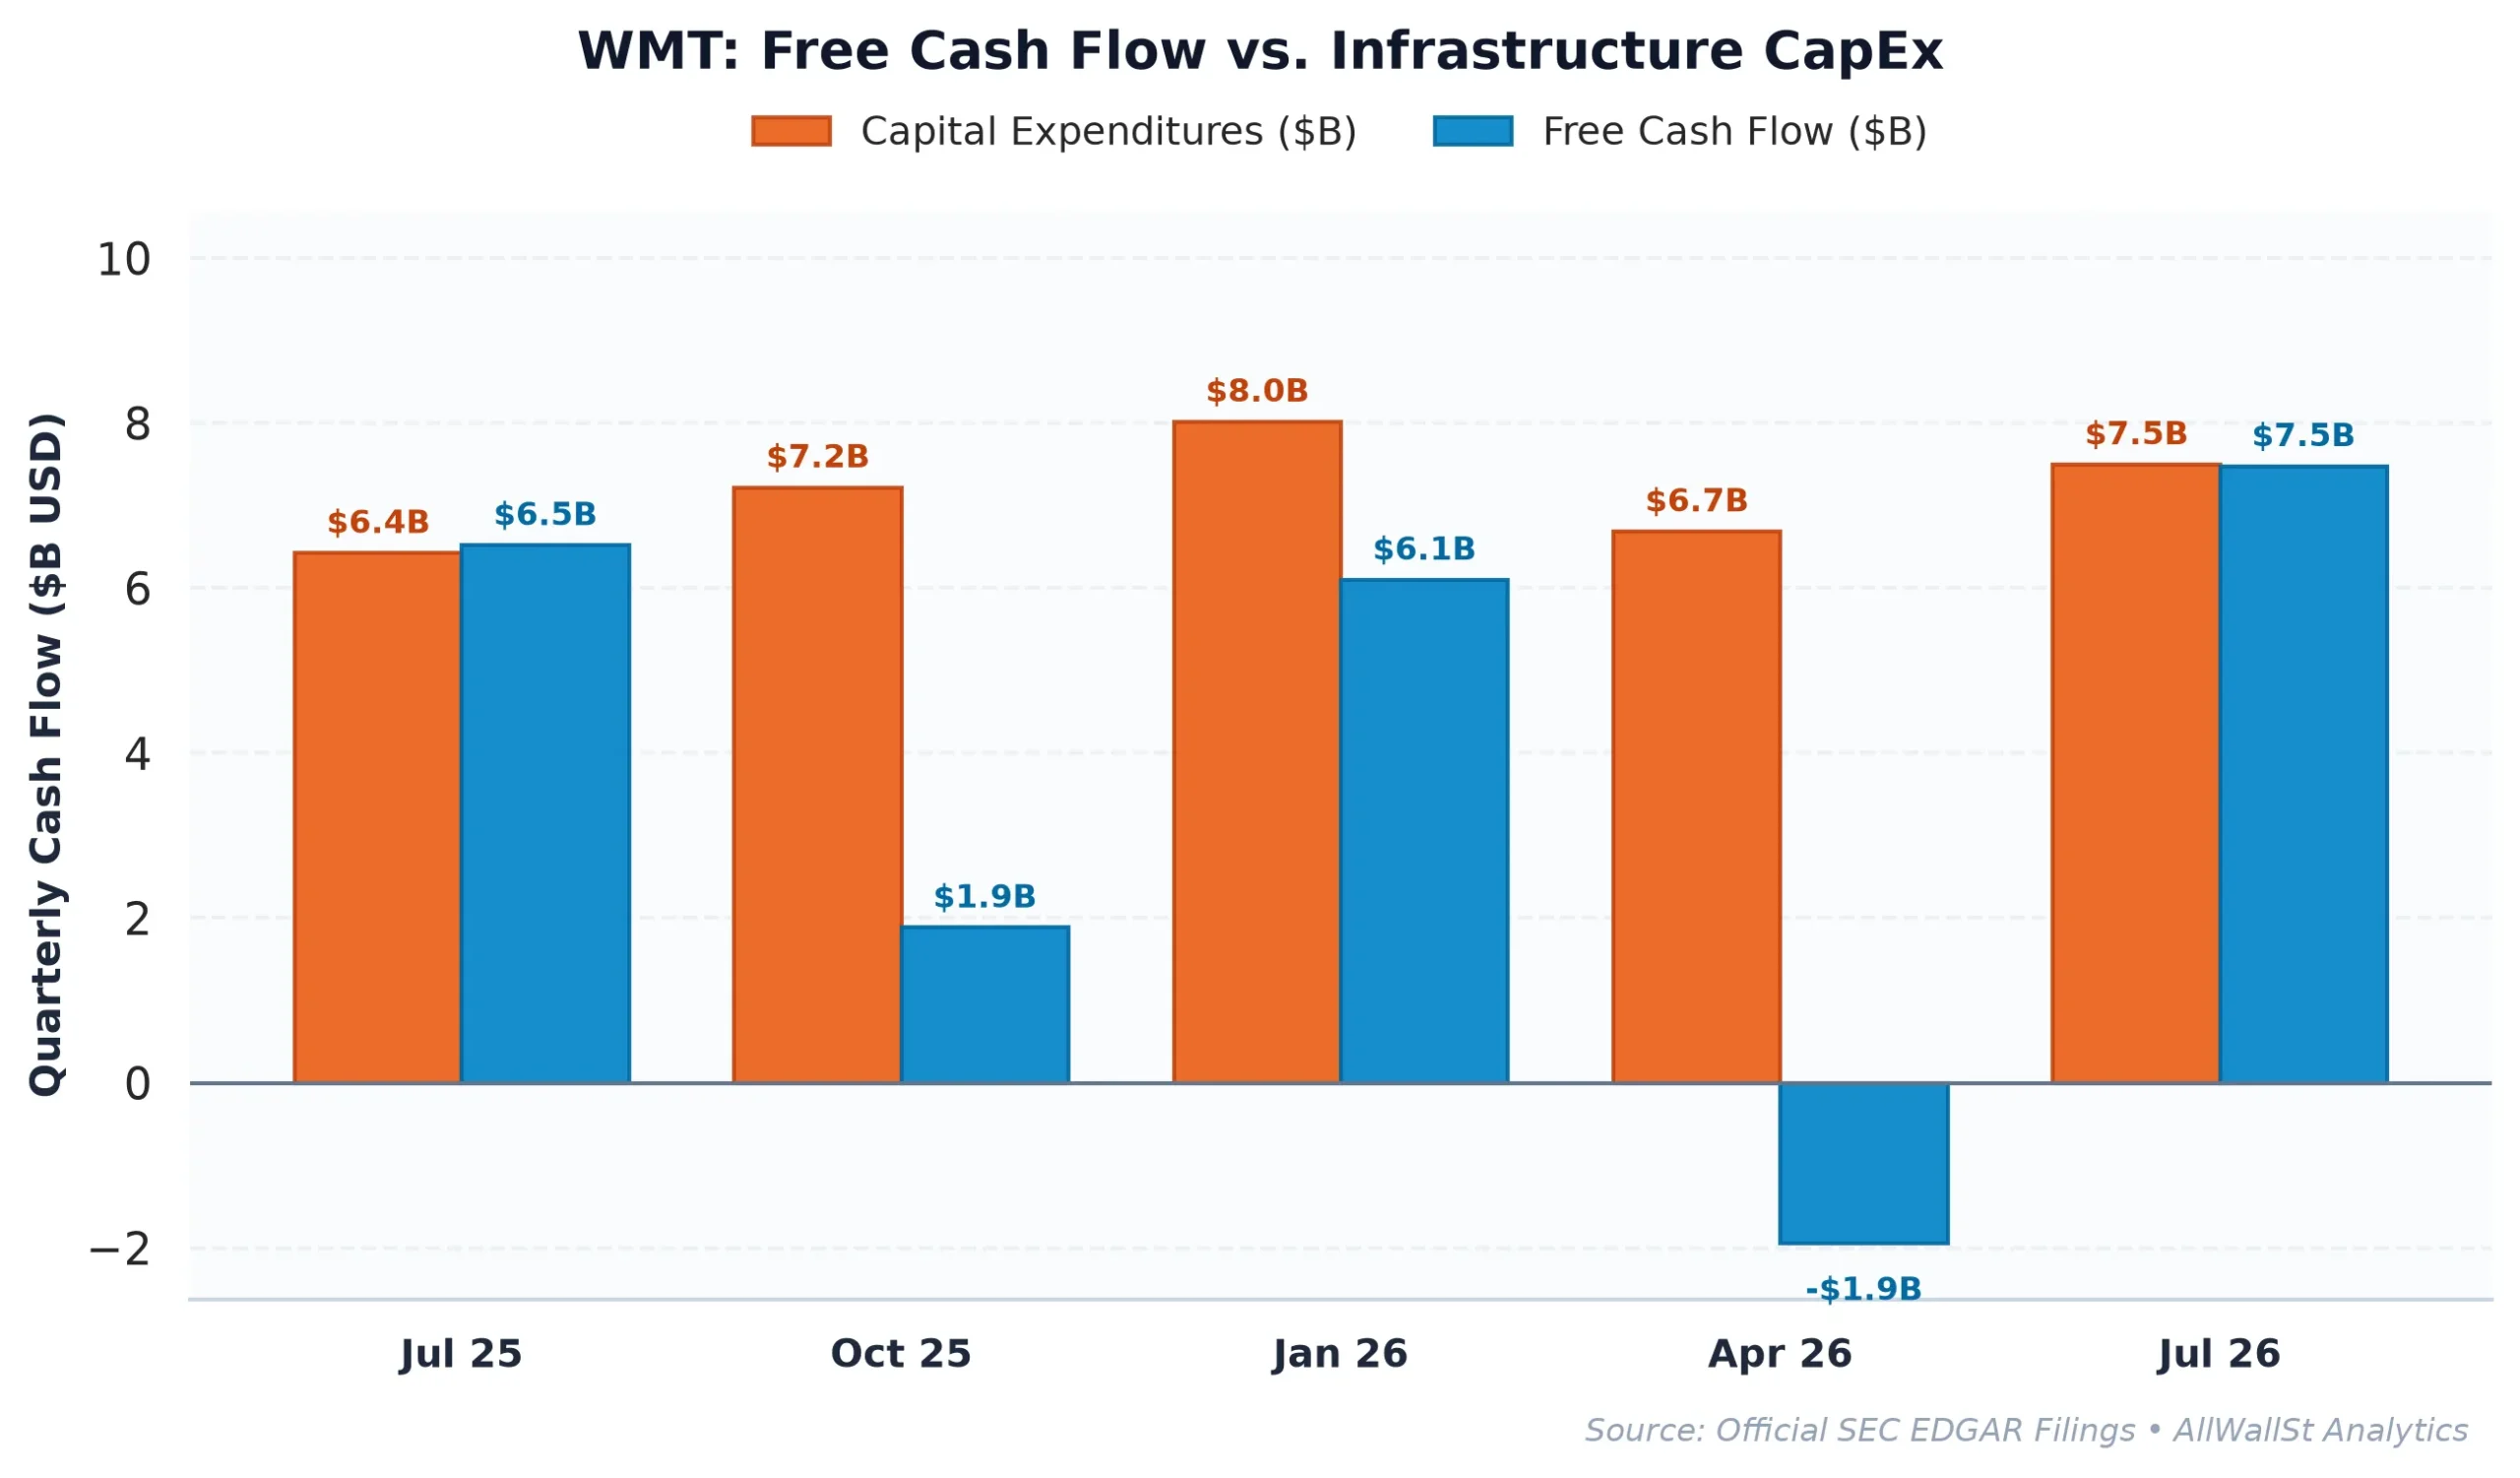
Yet the financial reality of physical retailing imposes sharp limits on cash generation. Over the trailing twelve months, Walmart generated $7.13 billion in free cash flow, translating to an equity free cash flow yield of just 0.71%. To put that figure into perspective, an investor holding safe, risk-free 10-Year US Treasuries collects a yield of 5.09% without needing to forecast quarterly supply chain shrink, warehouse wages, or transportation bottlenecks.
The resulting equity risk premium spread sits at -4.37%. The equity risk premium measures the excess cash return an equity investor receives for absorbing the operational risks of owning a business instead of sitting comfortably in sovereign government debt. When that spread is deeply negative, shareholders are essentially paying a steep liquidity premium to own physical inventory. Walmart’s capital expenditures absorbed $29.41 billion over the past year, representing 4.0% of total revenue as the company raced to automate distribution centers and retrofit stores. On November 16, the board even appointed Caterpillar chief executive Joseph E. Creed to its Audit and Finance committees to oversee automation and equipment execution, highlighting how capital-intensive this technological transformation truly is.
The Margin Gap Across the Retail Aisles
The standard justification for awarding Walmart a tech-like valuation multiple is that its business mix is fundamentally superior to traditional department stores and discount retailers. Advertising, third-party marketplace fees, and membership income carry far higher margins than selling gallons of milk.
Yet when placed side by side with its direct retail peers, the valuation premium appears entirely unmoored from underlying unit economics.
| Company (Ticker) | Market Cap | Forward P/E | EV/EBITDA | Rev Growth (YoY) | Operating Margin | FCF Yield |
|---|---|---|---|---|---|---|
| Walmart (WMT) | $998.3B | 38.9x | 24.5x | 5.90% | 3.94% | 0.71% |
| Costco Wholesale (COST) | $481.7B | 43.4x | 33.5x | 11.1% | 3.8% | 1.40% |
| Target (TGT) | $75.9B | 17.1x | 9.2x | 7.1% | 6.0% | 4.40% |
| Amazon.com (AMZN) | $2.88T | 24.4x | 16.8x | 12.1% | 13.1% | -1.21% |
A careful examination of the peer landscape reveals a startling divergence. Target trades at just 17.1x forward earnings while generating an operating margin of 6.0% and offering a free cash flow yield of 4.40%, nearly matching the risk-free Treasury benchmark. Target unquestionably carries higher exposure to discretionary apparel and home furnishings, but an investor pays less than half the earnings multiple for a business generating superior operating margins.
Meanwhile, Amazon.com trades at 24.4x forward earnings while compounding top-line revenue at 12.1%, backed by a cloud infrastructure giant that actually produces high-margin software revenues. At 38.9x forward earnings, Walmart is priced at a 59% premium to Amazon on a forward price-to-earnings basis, despite operating with an overall margin profile that remains tied to low-margin grocery baskets.
Costco commands an even higher multiple of 43.4x, but Costco operates a pure subscription model where membership fees account for the vast majority of operating income and inventory turns over before supplier invoices even come due. Walmart’s historical fundamental trajectory shows operating margins hovering consistently around 4.2% to 4.3% across FY2024 through FY2026. The narrative that Walmart is on the verge of doubling its corporate margins through ad tech ignores the sheer mathematical weight of its $700-plus billion retail merchandise base.
Options Plumbing and the $125 Pinning Effect
If fundamental cash flows cannot justify a 38.9x multiple, one must look toward modern market structure and derivative positioning to explain why the equity remains anchored near record highs. Modern equity prices are heavily governed by options market makers, who must continuously buy or sell underlying shares to balance their delta risk as option contracts fluctuate in value.
At the current spot price of $125.45, the options landscape exhibits a distinct structural ceiling. The front-month Put/Call Open Interest ratio sits at 0.66, reflecting a speculative skew where institutional and retail participants have aggressively accumulated upside call contracts. When call buying becomes overly crowded, it leaves the equity vulnerable to air pockets if upward momentum stalls, as option dealers unwind long stock hedges once those contracts decay.
The primary Call Wall is firmly stationed at the $125.00 strike, holding 55,809 contracts, with secondary resistance overhead at $130.00. A Call Wall represents the strike price with the largest concentration of call open interest, functioning as an institutional resistance zone where market makers who sold those calls actively sell underlying shares into rallies to maintain a delta-neutral book.
Beneath the current price, the options market exhibits significant downside drift toward the Max Pain strike at $115.00, which sits 8.33% below current trading levels. Max Pain is the precise dollar strike where the greatest cumulative number of put and call options expire completely worthless, exerting an algorithmic magnetic pull on spot prices heading into monthly expirations. The primary structural Put Wall does not emerge until $110.00, where 22,496 contracts provide institutional floor support. With 30-day implied volatility at 27.01%, the market prices an expected 30-day trading range of plus or minus $9.71, suggesting that any operational disappointment could swiftly test the $115 to $116 support shelf.
The Bottom Line on Retail Reality
Walmart remains one of the most operationally flawless retailing engines ever constructed. Its scale allows it to absorb supply chain shocks that would cripple smaller competitors, and its market share in domestic groceries provides an extraordinary defensive moat in an inflationary world. During the third quarter, the company repurchased $2.7 billion in shares at an average price of $110.12, deploying excess capital with mechanical consistency.
However, valuation discipline cannot be discarded simply because a grocery titan learns how to sell digital banner ads. At roughly forty times forward earnings, with a 0.71% free cash flow yield and a 5.09% Treasury alternative, investors are paying for complete perfection. The stock is currently pinned between a formidable $125 Call Wall and an $85-plus billion enterprise debt load that requires steady capital expenditure reinvestment. Until valuation multiples compress to better reflect physical retail margins, or the equity tests solid options support near its Put Wall, the risk-reward setup remains finely balanced.
Investment Committee Steelman Dissent: The bull case contends that Walmart Connect advertising and marketplace fulfillment fees are compounding at high double digits, fundamentally re-rating the business toward durable software margins. If high-income grocery market share gains prove structural and automation permanently lowers store labor expense, the company could sustain a 40x multiple through superior earnings compound acceleration.
AllWallSt Investment Verdict: HOLD
Walmart Inc. (WMT)
Sources & References
- Official SEC Form 10-K Annual Report (Filed 2026-03-13)
- Official SEC Form 10-Q Quarterly Report (Filed 2026-08-28)
- SEC Form 8-K Exhibit 99.1 (Press Release / Earnings) (2026-11-16)
- SEC Form 8-K Exhibit 99.1 (Press Release / Earnings) (2026-11-19)
- SEC SCHEDULE 13D/A Beneficial Ownership Disclosure (2026-08-07)
- SEC DEF 14A Proxy / M&A Filing (2026-04-23)
- Federal Register (2026-05-27): Phasedown of Hydrofluorocarbons: Allocation of 2026 Production and Consumption…
-
Walmart Inc. SEC EDGAR Corporate Filings: SEC CIK 0000104169
- Walmart Inc. Investor Relations: https://www.stock.walmart.com
- Form 8-K Earnings Presentation & Release (Q3 FY27), filed November 19, 2026.
- Form 8-K Board of Directors Appointment (Item 5.02), filed November 16, 2026.
- U.S. Department of the Treasury: Daily Treasury Par Yield Curve Rates.
Disclaimer: This analysis is published for institutional informational purposes only and does not constitute personalized financial, investment, legal, or tax advice. Past financial performance and derivative positioning do not guarantee future equity returns.